

Shipments of Household Appliances. The time plot in Figure 18 . 31 shows the series of quarterly
Question:
Shipments of Household Appliances. The time plot in Figure 18 . 31 shows the series of quarterly shipments (in million dollars) of US household appliances between 1985 and 1989 (dataare available in ApplianceShipments.csv, data courtesy of Ken Black). If we compute the autocorrelation of the series, which lag (>0) is most likely to have the largest coefficient (in absolute value)? Create an ACF plot and compare with your answer.
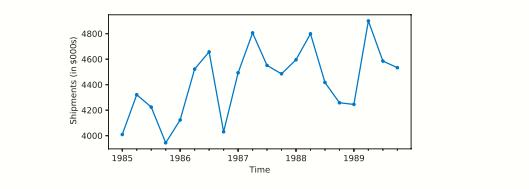 FIGURE 18 . 31 QUARTERLY SHIPMENTS OF US HOUSEHOLD APPLIANCES OVER FIVE YEARS
Step by Step Answer:

This question has not been answered yet.
You can Ask your question!
Related Book For 

Machine Learning For Business Analytics
ISBN: 9781119828792
1st Edition
Authors: Galit Shmueli, Peter C. Bruce, Amit V. Deokar, Nitin R. Patel
Question Posted:
