

Table 9.15 shows U.S. data for C = real per capita consumption and Y = real per
Question:
Table 9.15 shows U.S. data for C = real per capita consumption and Y = real per capita disposable personal income.
a. Draw a scatter diagram.
b. Estimate the consumption function C = α + βY + ε.
c. Calculate the residuals e = C − (a + bY) for each year and make a scatter diagram with e on the vertical axis and the year on the horizontal axis.
d. Do you see anything in this residuals plot that suggests that the least squares assumptions might be violated?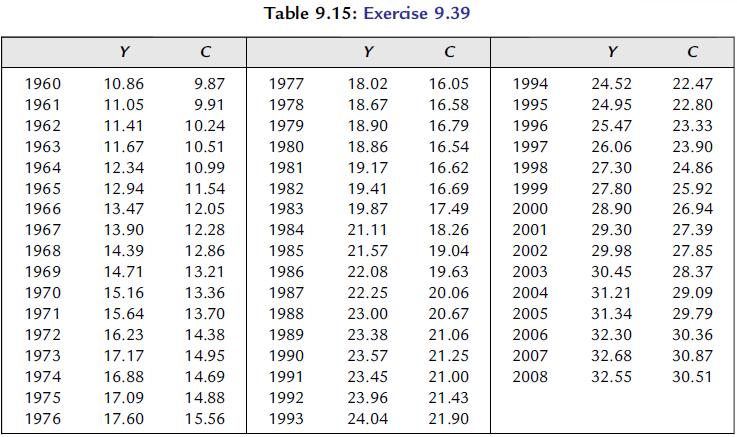
Step by Step Answer:

This question has not been answered yet.
You can Ask your question!
Related Book For 

Essential Statistics Regression And Econometrics
ISBN: 9780123822215
1st Edition
Authors: Gary Smith
Question Posted:
