

The paper Crop Improvement for Tropical and Subtropical Australia: Designing Plants for Difficult Climates (Field Crops Research
Question:
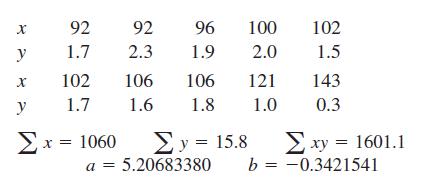
The paper “Crop Improvement for Tropical and Subtropical Australia: Designing Plants for Difficult Climates” (Field Crops Research [1991]: 113–139) gave the following data on x = crop duration (in days) for soybeans and y = crop yield (in tons per hectare):
a. Construct a scatterplot of the data. Do you think the least-squares line will give accurate predictions? Explain.
b. Delete the observation with the largest x value from the sample and recalculate the equation of the least-squares line. Does this observation greatly affect the equation of the line?
c. What effect does the deletion in Part (b) have on the value of r2? Can you explain why this is so?
Step by Step Answer:
To answer the questions lets first interpret the given data x Crop duration in days for soybeans y C...View the full answer


Introduction To Statistics And Data Analysis
ISBN: 9780495118732
3rd Edition
Authors: Roxy Peck, Chris Olsen, Jay L. Devore
