

Question: Start with the partial model in the file Ch06 P14 Build a Model.xls on the textbook's Web site. The file contains hypothetical data for working
Start with the partial model in the file Ch06 P14 Build a Model.xls on the textbook's Web site. The file contains hypothetical data for working this problem. Bartman Industries's and Reynolds Incorporated's stock prices and dividends, along with the Market Index, are shown below. Stock prices are reported for December 31 of each year, and dividends reflect those paid during the year. The market data are adjusted to include dividends.
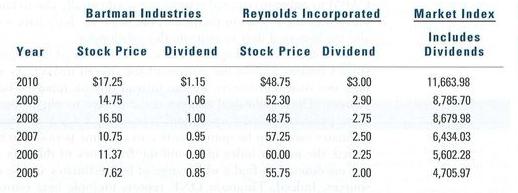
a. Use the data given to calculate annual returns for Bartman, Reynolds, and the Market Index, and then calculate average annual returns for the two stocks and the index.
b. Calculate the standard deviations of the returns for Bartman, Reynolds, and the Market Index.
c. Now calculate the coefficients of variation for Bartman, Reynolds, and the Market Index.
d. Construct a scatter diagram graph that shows Bartman's returns on the vertical axis and the Market Index's returns on the horizontal axis. Construct a similar graph showing Reynolds's stock returns on the vertical axis.
e. Estimate Bartman's and Reynolds's betas as the slopes of regression lines with stock return on the vertical axis (y-axis) and market return on the horizontal axis (x-axis). Are these betas consistent with your graph?
f. The risk-free rate on long-term Treasury bonds is 6.04%. Assume that themarket risk premium is 5%. What is the required return on the market?Now use the SML equation to calculate the two companies' required returns.
g. If you formed a portfolio that consisted of 50% Bartman stock and 50% Reynolds stock, what would be its beta and its required return?
h. Suppose an investor wants to include some Bartman Industries stock in his portfolio.Stocks A, B, and C are currently in the portfolio, and their betas are 0.769,0.985, and 1.423, respectively. Calculate the new portfolio's required return ifit consists of 25% Bartman, 15% Stock A, 40% Stock B, and 20% Stock C.
Step by Step Solution
3.37 Rating (156 Votes )
There are 3 Steps involved in it

Get step-by-step solutions from verified subject matter experts