

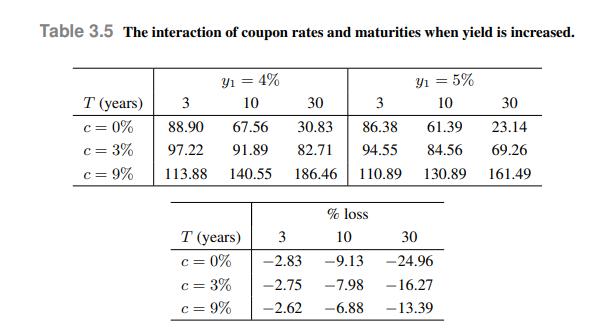
Let us check the application of duration to the bonds that we considered in Table 3.5. The
Question:
Let us check the application of duration to the bonds that we considered in Table 3.5. The duration of each zero corresponds to its maturity. So, using Eq. (3.41), the prediction of the price of the zero maturing in three years is, after the increase of yield,
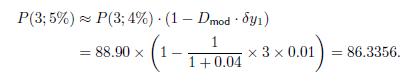
This is fairly close to the exact price, which is 86.38 . We notice that the duration-based prediction is somewhat pessimistic, as the actual bond price after the increase in yield is larger. The same calculation for the bond maturing in 30 years gives
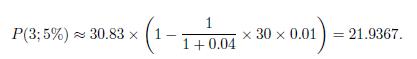
In this case, the prediction is definitely pessimistic with respect to the actual price, which is 23.14.
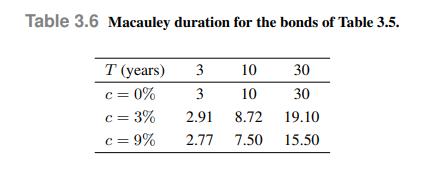
Table 3.6 also shows the Macauley duration of the six couponbearing bonds of Table 3.5, featuring different maturities and coupon rates. These values may be obtained by direct application of the definition, which is somewhat inconvenient when 30 cash flows are involved, or by an analytical formula that we shall prove later. Let us check the accuracy for the \(9 \%\) bonds maturing in 3 and 30 years:
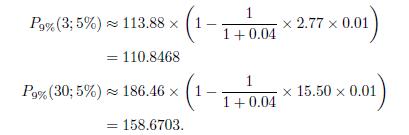
Again, by comparing the approximations with the exact prices in Table 3.5 , we see that the approximation is pessimistic, but pretty accurate for a short maturity, a bit less for a long maturity.
Data From Table 3.5
Data From Table 3.6
Data From Equation (3.41).
Step by Step Answer:


An Introduction To Financial Markets A Quantitative Approach
ISBN: 9781118014776
1st Edition
Authors: Paolo Brandimarte
