

Let us consider three portfolios, with expected return and standard deviation given in Table 8.1. Comparing (P
Question:
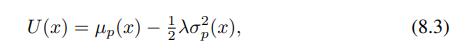
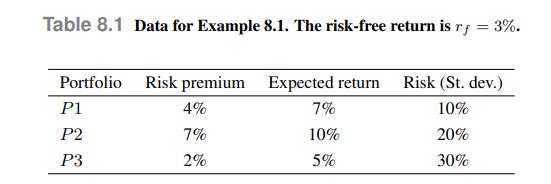
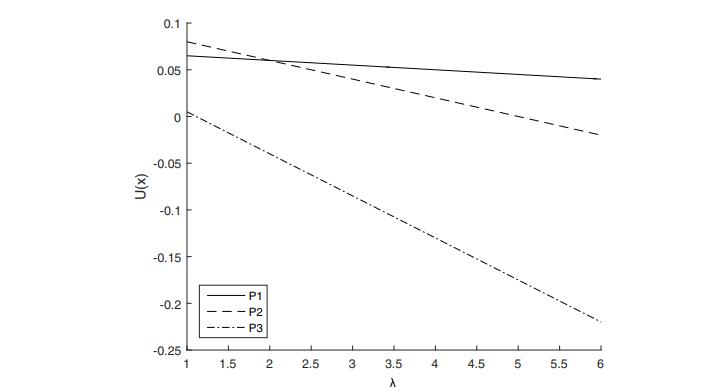
Let us consider three portfolios, with expected return and standard deviation given in Table 8.1. Comparing \(P 1\) and \(P 2\), we observe that the former is less risky than the latter, but it features a lower expected return. The choice between the two depends on the degree of risk aversion. In Figure 8.1, we plot the expected utility of Eq. (8.3) for a range of values of , which results in a plain straight line for each portfolio. We observe that there is a critical value for which a decision maker would be indifferent between \(P 1\) and \(P 2\). On the contrary, \(P 3\) looks always worse than the other two alternatives. Indeed, we observe from Table 8.1 that it features the smallest expected return and the largest risk.
Data From Equation (8.3)
Data From Table 8.1
Data From Figure 8.1
Step by Step Answer:

This question has not been answered yet.
You can Ask your question!

An Introduction To Financial Markets A Quantitative Approach
ISBN: 9781118014776
1st Edition
Authors: Paolo Brandimarte
