

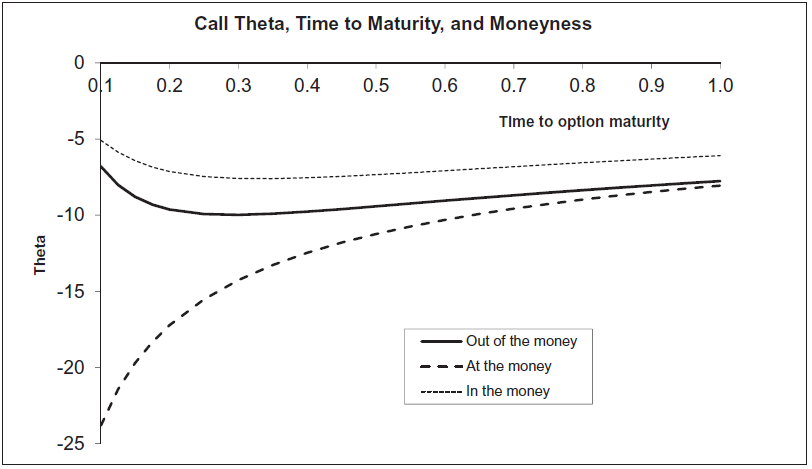
Figure 18.4 shows the call theta as a function of time to maturity. Produce a similar graph
Question:
Figure 18.4 shows the call theta as a function of time to maturity. Produce a similar graph for puts.
Fantastic news! We've Found the answer you've been seeking!
Step by Step Answer:

Answered By
Muhammad Haroon
More than 3 years experience in teaching undergraduate and graduate level courses which includes Object Oriented Programming, Data Structures, Algorithms, Database Systems, Theory of Automata, Theory of Computation, Database Administration, Web Technologies etc.
3+ Reviews
10+ Question Solved
Related Book For 
Question Posted:
