

Question: FIGURE EX30.18 shows the current as a function of time through a 20-cm-long, 4.0-cm-diameter solenoid with 400 turns. Draw a graph of the induced electric
FIGURE EX30.18 shows the current as a function of time through a 20-cm-long, 4.0-cm-diameter solenoid with 400 turns. Draw a graph of the induced electric field strength as a function of time at a point 1.0 cm from the axis of the solenoid.
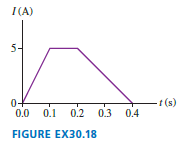
I (A) 5- 0+ 0.0 0.1 0.2 - (s) 0.4 0.3 0.4 FIGURE EX30.18
Step by Step Solution
★★★★★
3.26 Rating (158 Votes )
There are 3 Steps involved in it
1 Expert Approved Answer
Step: 1 Unlock

Model A changing magnetic field creates an electric field Solve Th... View full answer
Question Has Been Solved by an Expert!
Get step-by-step solutions from verified subject matter experts
Step: 2 Unlock
Step: 3 Unlock