

Question: please answer these questions! Question 4 Selected comparative statement data for Queen Products Company are presented below. All balance sheet data are as of December
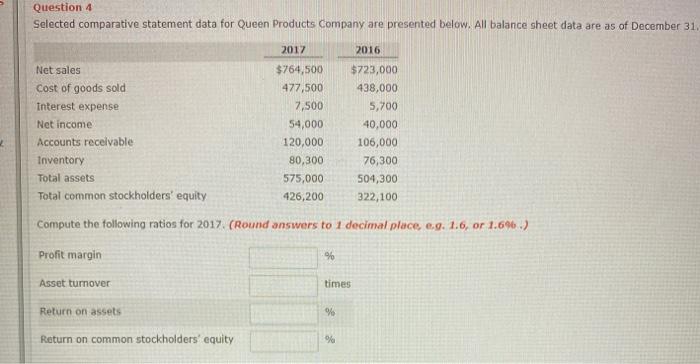
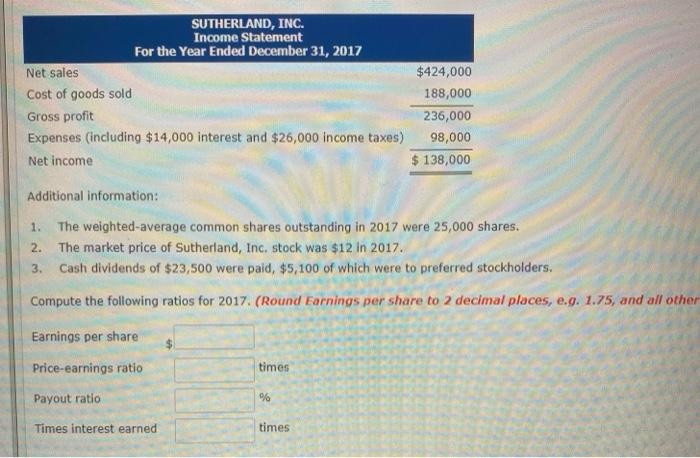
Question 4 Selected comparative statement data for Queen Products Company are presented below. All balance sheet data are as of December 31. 2017 2016 Net sales $764,500 $723,000 Cost of goods sold 477,500 438,000 Interest expense 7,500 5,700 Net income 54,000 40,000 Accounts receivable 120,000 106,000 Inventory 80,300 76,300 Total assets 575,000 504,300 Total common stockholders' equity 426,200 322,100 Compute the following ratios for 2017 (Round answers to 1 decimal place 0.9. 1.6, or 1.6%) Profit margin % Asset turnover times Return on assets % Return on common stockholders' equity % SUTHERLAND, INC. Income Statement For the Year Ended December 31, 2017 Net sales $424,000 Cost of goods sold 188,000 Gross profit 236,000 Expenses (including $14,000 interest and $26,000 income taxes) 98,000 Net income $ 138,000 Additional information: 1. 2. The weighted average common shares outstanding in 2017 were 25,000 shares. The market price of Sutherland, Inc. stock was $12 in 2017. Cash dividends of $23,500 were paid, $5,100 of which were to preferred stockholders. Compute the following ratios for 2017. (Round Earnings per share to 2 decimal places, e.g. 1.75, and all other 3. Earnings per share Price-earnings ratio times Payout ratio % Times interest earned times
Step by Step Solution
There are 3 Steps involved in it

Get step-by-step solutions from verified subject matter experts