

Table 1 describes five possible outcomes in a country for 2017, depending on the level of aggregate
Question:
Table 1 describes five possible outcomes in a country for 2017, depending on the level of aggregate demand in that year. Potential GDP is $10 trillion, and the natural unemployment rate is 5 percent.

1. Calculate the inflation rate for each possible outcome.
2. Use Okun’s Law to find real GDP at each unemployment rate in Table 1.
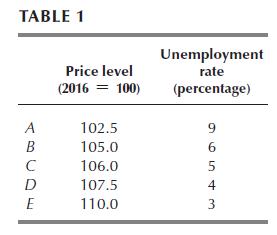
3. What are the expected price level and the expected inflation rate in 2017?
4. Plot the short-run Phillips curve for 2017. Mark the points A, B, C, D, and E that correspond to the data in Table 1 and that you have calculated.

5. Plot the aggregate supply curve for 2017. Mark the points A, B, C, D, and E that correspond to the data in Table 1.

Fantastic news! We've Found the answer you've been seeking!
Step by Step Answer:
1 The inflation rate in 2017 equals the price level in 2017 minus the price level in 2016 So for A t...View the full answer

Answered By
Shivani Dubey
Hello guys, I am very good with the Advance mathematics, Calculus, Number theory, Algebra, Linear algebra, statistics and almost all topics of mathematics. I used to give individual tutoring students in offline mode but now want to help students worldwide so I am joining here. I can also give solutions in various coding languages of mathematics and software like mathematica, R, Latex, Matlab, Statistica, etc.
feel free to ask any doubt regarding mathematics
2+ Reviews
10+ Question Solved
Related Book For 
Question Posted:
