

The spreadsheet in Table 1 provides data on the U.S. economy: Column A is the year; the
Question:
The spreadsheet in Table 1 provides data on the U.S. economy: Column A is the year; the other columns are quantities sold in millions per year of compact discs (column B), music videos (column C), and singles downloads (column D).
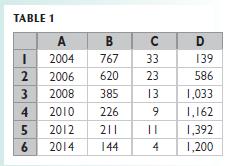
Draw a scatter diagram to show the relationship between quantities sold of music videos and singles downloads. Describe the relationship.
Fantastic news! We've Found the answer you've been seeking!
Step by Step Answer:
To draw a scatter diagram showing the relationship between quantities sold of music videos and s...View the full answer

Answered By
GERALD KAMAU
non-plagiarism work, timely work and A++ work
6+ Reviews
11+ Question Solved
Related Book For 

Question Posted:
