

The spreadsheet in the table provides data on the U.S. economy: Column A is the year; the
Question:
The spreadsheet in the table provides data on the U.S. economy: Column A is the year; the other columns are quantities sold in millions per year of compact discs (column B), music videos (column C), and video streaming (column D). Use this spreadsheet to work Problems.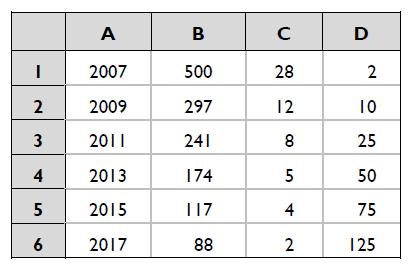
Draw a scatter diagram to show the relationship between the quantities sold of compact discs and music videos. Describe the relationship.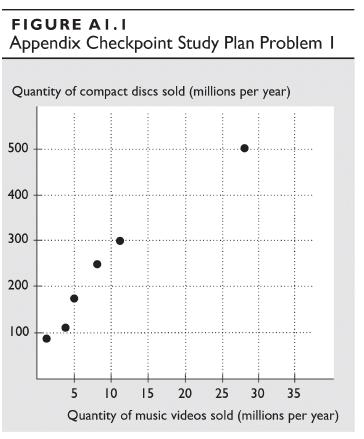
Fantastic news! We've Found the answer you've been seeking!
Step by Step Answer:
Figure A11 illustrates the relationship of the data from the spreadsheet between the quantities s...View the full answer

Answered By
YOGENDRA NAILWAL
As I'm a Ph.D. student, so I'm more focussed on my chemistry laboratory. I have qualified two national level exams viz, GATE, and NET JRF (Rank 68). So I'm highly qualified in chemistry subject. Also, I have two years of teaching experience in this subject, which includes college teacher as well as a personal tutor. I can assure you if you hire me on this particular subject, you are never going to regret it.
Best Regards.
1+ Reviews
10+ Question Solved
Related Book For 

Question Posted:
