

The spreadsheet in the table provides data on the U.S. economy: Column A is the year; the
Question:
The spreadsheet in the table provides data on the U.S. economy: Column A is the year; the other columns are quantities sold in millions per year of compact discs (column B), music videos (column C), and video streaming (column D). Use this spreadsheet to work Problems.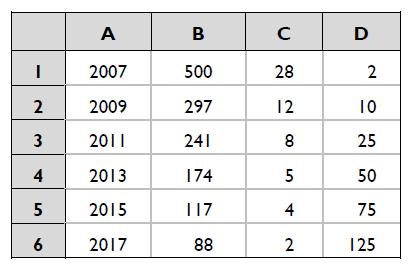 Draw a time-series graph of quantity of compact discs sold. Say in which year or years the quantity sold
(a) Was highest,
(b) Was lowest,
(c) Increased the most, and
(d) Decreased the most. If the data show a trend, describe it.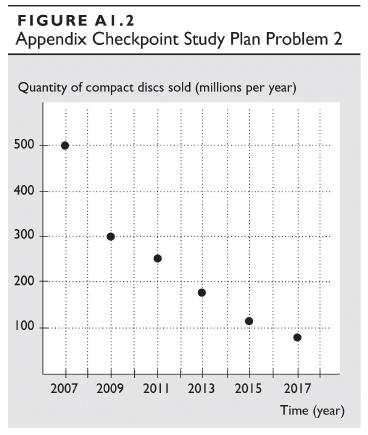
Fantastic news! We've Found the answer you've been seeking!
Step by Step Answer:
Figure A12 illustrates the time series of the quantity of co...View the full answer

Answered By
ANDREW KIPRUTO
Academic Writing Expert
I have over 7 years of research and application experience. I am trained and licensed to provide expertise in IT information, computer sciences related topics and other units like chemistry, Business, law, biology, biochemistry, and genetics. I'm a network and IT admin with +8 years of experience in all kind of environments.
I can help you in the following areas:
Networking
- Ethernet, Wireless Airmax and 802.11, fiber networks on GPON/GEPON and WDM
- Protocols and IP Services: VLANs, LACP, ACLs, VPNs, OSPF, BGP, RADIUS, PPPoE, DNS, Proxies, SNMP
- Vendors: MikroTik, Ubiquiti, Cisco, Juniper, HP, Dell, DrayTek, SMC, Zyxel, Furukawa Electric, and many more
- Monitoring Systems: PRTG, Zabbix, Whatsup Gold, TheDude, RRDtoo
Always available for new projects! Contact me for any inquiries
1+ Reviews
10+ Question Solved
Related Book For 

Question Posted:
