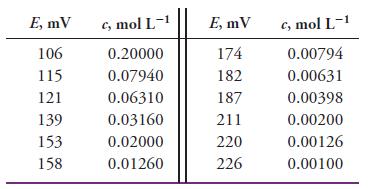
The data in the following table represent electrode potential E versus concentration c. (a) Transform the data
Question:
The data in the following table represent electrode potential E versus concentration c.

(a) Transform the data to E versus -log c values.
(b) Plot E versus -log c, and find the least-squares estimate of the slope and intercept. Write the least squares equation.
(c) Find the 95% confidence intervals for the slope and intercept.
(d) Use the F test to comment on the significance of regression.
(e) Find the standard error of the estimate, the correlation coefficient, and the multiple correlation coefficient squared.
Fantastic news! We've Found the answer you've been seeking!
Step by Step Answer:
Related Book For 

Fundamentals Of Analytical Chemistry
ISBN: 9780357450390
10th Edition
Authors: Douglas A. Skoog, Donald M. West, F. James Holler, Stanley R. Crouch
Question Posted:


