

What is the estimated OR for hypertension comparing Hispanic boys vs. Caucasian boys? (Call this OR1.) What
Question:
Hypertension
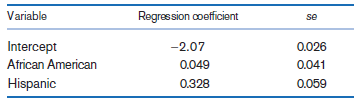
An important issue is whether there are racial differences in hypertension among children. We define hypertension as being above the 95th percentile for either systolic blood pressure (SBP) or diastolic blood pressure (DBP) among children of the same age, height, and sex. Since some of the children were observed at multiple visits, a GEE model was run of hypertension on ethnic group. There were three ethnic groups considered: Caucasian, African American, and Hispanic. The results among boys are given in Table 13.54.
Table 13.54 Relationship between hypertension and ethnic group among 27,009 boys in the Pediatric Task Force Data
Fantastic news! We've Found the answer you've been seeking!
Step by Step Answer:
The estimated OR for hypertension c...View the full answer

Answered By
Hillary Waliaulah
As a tutor, I am that experienced with over 5 years. With this, I am capable of handling a variety of subjects.
17+ Reviews
30+ Question Solved
Related Book For 
Question Posted:
