

Using tabulated experimental data from the literature for either the excess molar volume or excess molar enthalpy
Question:
Using tabulated experimental data from the literature for either the excess molar volume or excess molar enthalpy of a system of your choice, provide the following information.
A. A plot of the excess property (either molar volume or molar enthalpy) as a function of composition.
B. A functional description of the excess property using the composition as an independent variable.
C. A plot of the partial molar property (either vol ume or enthalpy) as a function of composition.
D. Does the system behave according to the ideal solution model? If not, please explain why.
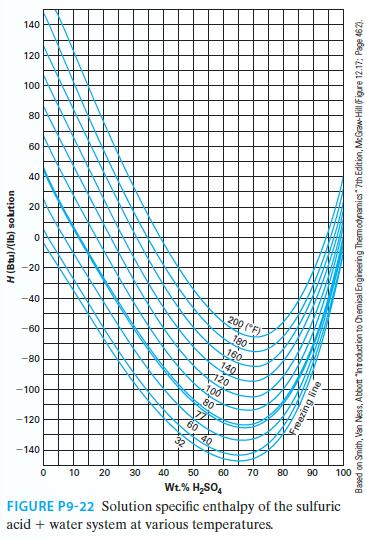
For the next three problems, use Figure P9-22 for the sulfuric acid 1 water system (Smith et al., 2005).
Step by Step Answer:

This question has not been answered yet.
You can Ask your question!

Fundamentals Of Chemical Engineering Thermodynamics
ISBN: 9781111580704
1st Edition
Authors: Kevin D. Dahm, Donald P. Visco
