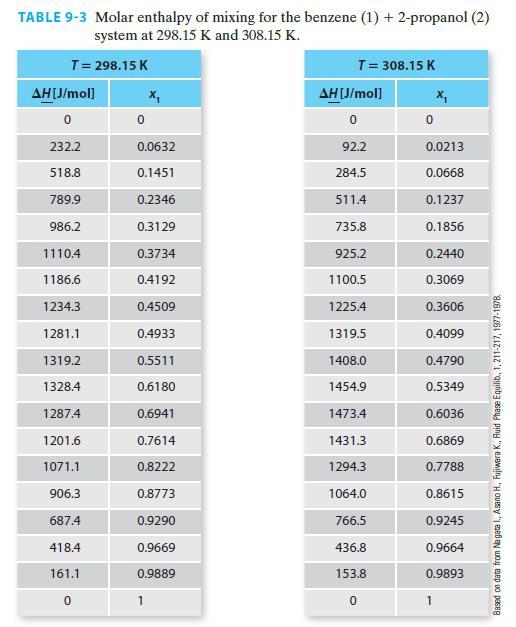
Using the information from Table 9-3, plot the partial molar enthalpies of both components at both temperatures
Question:
Using the information from Table 9-3, plot the partial molar enthalpies of both components at both temperatures on the same curve as a function of composition. You may have already completed some of the needed work in Exercise 9-3.
Exercise 9-3.
Using the data for the benzene (1) + 2-propanol (2) system in Table 9-3, fit the experimental data to an appropriate polynomial equation whose independent variable is the mole fraction of ethanol. Work with only the 298.15 K data set.

Step by Step Answer:
Related Book For 

Fundamentals Of Chemical Engineering Thermodynamics
ISBN: 9781111580704
1st Edition
Authors: Kevin D. Dahm, Donald P. Visco
Question Posted:


