

For each of the following situations, create a scatterplot of the data and describe the nature, direction,
Question:
For each of the following situations, create a scatterplot of the data and describe the nature, direction, and strength of the relationship.
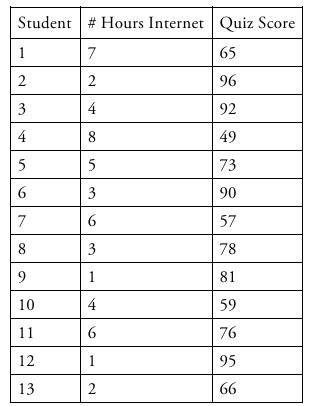
a. A set of parents hypothesize there is a negative relationship between the average number of hours their children spend on the Internet and their scores on a recent school quiz (range = 0–100).
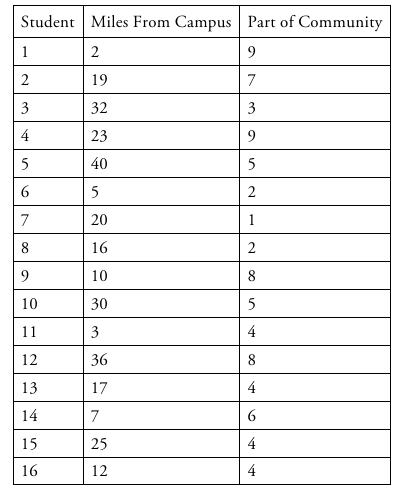
b. A college counselor hypothesizes that the farther students live from campus (in miles), the less they feel they are part of the school community (1 = low, 10 = high).
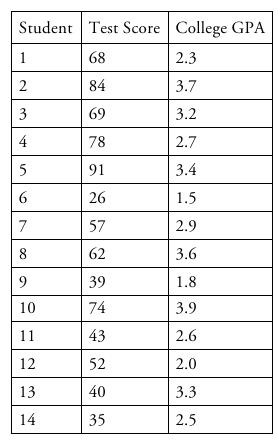
c. A publishing company develops a new college admissions test and hypothesizes that scores on the test are positively related to academic achievement in college.
The company administers the test to a sample of college students (possible scores range from 0–100) and collects college grade point averages (GPAs) of the students.
Step by Step Answer:


Fundamental Statistics For The Social And Behavioral Sciences
ISBN: 9781483318790
1st Edition
Authors: Howard T. Tokunaga
