

For each of the following situations, create a scatterplot of the data and describe the nature, direction,
Question:
For each of the following situations, create a scatterplot of the data and describe the nature, direction, and strength of the relationship.
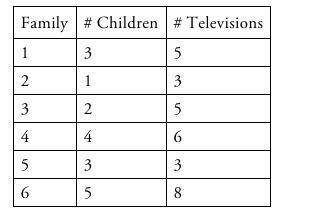
a. A researcher hypothesizes a positive relationship between the number of children in a family and the number of televisions a family owns.
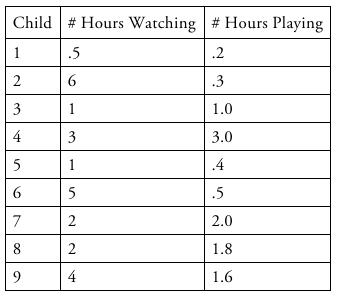
b. Is there a relationship between the amount of time spent watching sports on television and the amount of time actually playing sports? The following data are from a small sample of children who reported their average number of daily hours spent watching sports on television and playing sports.
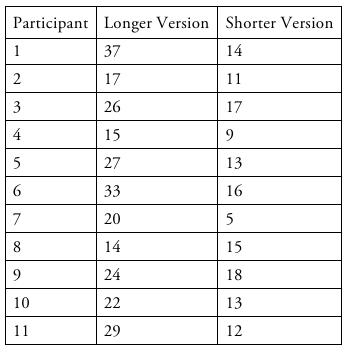
c. A test developer gives people two versions of a survey (a longer version that contains 40 items and a shorter version that contains 20 items) and wants to see if scores on the two versions are related to each other.
Step by Step Answer:


Fundamental Statistics For The Social And Behavioral Sciences
ISBN: 9781483318790
1st Edition
Authors: Howard T. Tokunaga
