New Semester
Started
Get
50% OFF
Study Help!
--h --m --s
Claim Now
Question Answers
Textbooks
Find textbooks, questions and answers
Oops, something went wrong!
Change your search query and then try again
S
Books
FREE
Study Help
Expert Questions
Accounting
General Management
Mathematics
Finance
Organizational Behaviour
Law
Physics
Operating System
Management Leadership
Sociology
Programming
Marketing
Database
Computer Network
Economics
Textbooks Solutions
Accounting
Managerial Accounting
Management Leadership
Cost Accounting
Statistics
Business Law
Corporate Finance
Finance
Economics
Auditing
Tutors
Online Tutors
Find a Tutor
Hire a Tutor
Become a Tutor
AI Tutor
AI Study Planner
NEW
Sell Books
Search
Search
Sign In
Register
study help
business
statistics for engineers and scientists
Introduction To Probability And Statistics For Engineers And Scientists 4th Edition Sheldon M. Ross - Solutions
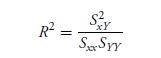
Prove the identity R S xY SSyy
The regression model Y = βx +e, e ∼ N(0, σ2)is called regression through the origin since it presupposes that the expected response corresponding to the input level x = 0 is equal to 0. Suppose that(xi , Yi), i = 1, . . . , n is a data set from this model.(a) Determine the least squares
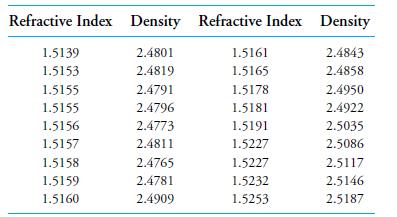
Glass plays a key role in criminal investigations, because criminal activity often results in the breakage of windows and other glass objects. Since glass fragments often lodge in the clothing of the criminal, it is of great importance to be able to identify such fragments as originating at the
A screw manufacturer is interested in giving out data to his customers on the relation between nominal and actual lengths. The following results (in inches)were observed.(a) Estimate the regression coefficients.(b) Estimate the variance involved in manufacturing a screw.(c) For a large set of
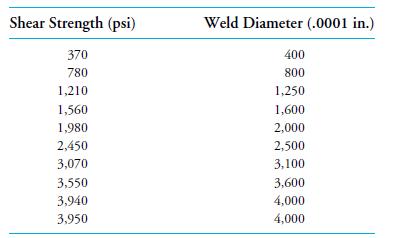
The determination of the shear strength of spot welds is relatively difficult, whereas measuring the weld diameter of spot welds is relatively simple. As a result, it would be advantageous if shear strength could be predicted from a measurement of weld diameter. The data are as follows:(a) Draw a
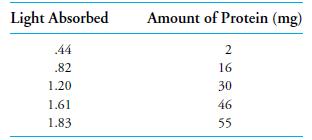
It is difficult and time consuming to measure directly the amount of protein in a liver sample. As a result, medical laboratories often make use of the fact that the amount of protein is related to the amount of light that would be absorbed by the sample. As a result, a spectrometer that emits
Plot the standardized residuals from the data of Problem 1. What does the plot indicate about the assumptions of the linear regression model?
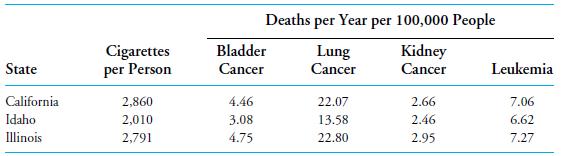
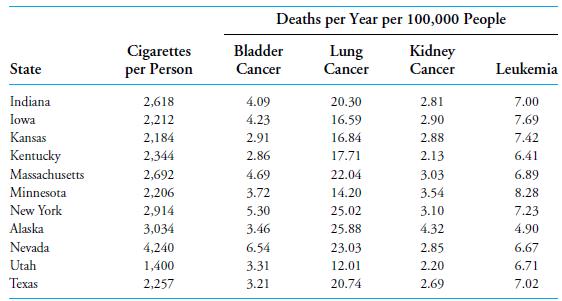
(a) Estimate the variances in Problems 19 through 22.(b) Determine a 95 percent confidence interval for the variance in the data relating to lung cancer.(c) Break up the lung cancer data into two parts — the first corresponding to states whose average cigarette consumption is less than 2,300, and
(a) Draw a scatter diagram of cigarettes smoked versus death rate from leukemia.(b) Estimate the regression coefficients.(c) Test the hypothesis that there is no regression of the death rate from leukemia on the number of cigarettes used. That is, test that β = 0.(d) Determine a 90 percent
(a) Draw a scatter diagram of cigarette use versus death rate from kidney cancer.(b) Estimate the regression line.(c) What is the p-value in the test that the slope of the regression line is 0?(d) Determine a 90 percent confidence interval for the mean death rate from kidney cancer in a state whose
(a) Draw a scatter diagram relating cigarette use and death rates from lung cancer.(b) Estimate the regression parameters α and β.(c) Test at the .05 level of significance the hypothesis that cigarette consumption does not affect the death rate from lung cancer.(d) What is the p-value of the test
(a) Draw a scatter diagram of cigarette consumption versus death rate from bladder cancer.(b) Does the diagram indicate the possibility of a linear relationship?(c) Find the best linear fit.(d) If next year’s average cigarette consumption is 2,500, what is your prediction of the death rate from
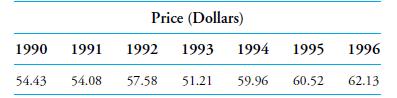
The following data give the average price of all books reviewed in the journal Science in the years from 1990 to 1996.Give an interval that, with 95 percent confidence, will contain the average price of all books reviewed in Science in 1997 and in 1998.Problems 19 through 23 refer to the following
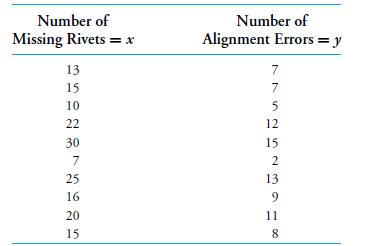
The following data represent the relationship between the number of alignment errors and the number of missing rivets for 10 different aircraft.(a) Plot a scatter diagram.(b) Estimate the regression coefficients.(c) Test the hypothesis that α = 1.(d) Estimate the expected number of alignment
Verify Equation 9.4.3.
Experienced flight instructors have claimed that praise for an exceptionally fine landing is typically followed by a poorer landing on the next attempt, whereas criticism of a faulty landing is typically followed by an improved landing. Should we thus conclude that verbal praise tends to lower
A study has shown that a good model for the relationship between X and Y , the first and second year batting averages of a randomly chosen major league baseball player, is given by the equation Y = .159 + .4X + e where e is a normal random variable with mean 0. That is, the model is a simple linear
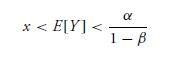
Suppose in the simple linear regression model Y = α + βx + e that 0 (a) Show that if x (b) Show that if x > α/(1 − β), thenand conclude that E[Y ] is always between x and α/(1 − β). x < E[Y] < 1-B
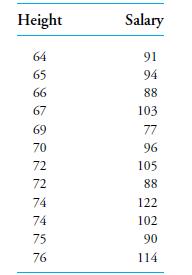
The following data set presents the heights of 12 male law school classmates whose law school examination scores were roughly equal. It also gives their first year salaries. Each of them went into corporate law. The height is in inches and the salary in units of $1,000.(a) Do the above data
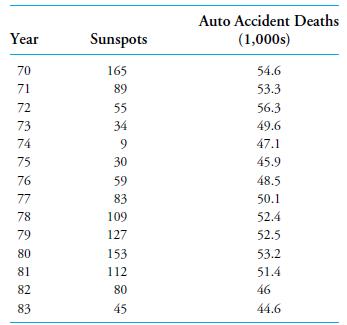
The following table relates the number of sunspots that appeared each year from 1970 to 1983 to the number of auto accident deaths during that year. Test the hypothesis that the number of auto deaths is not affected by the number of sunspots. (The sunspot data are from Jastrow and Thompson,
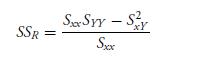
Verify that Sxx Syy - Szy SSR = xY Sxx
In Problem 4,(a) Estimate the variance of an individual response.(b) Determine a 90 percent confidence interval for the variance.
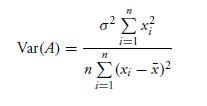
Verify Equation 9.3.3, which states that Var(A) = 02 n i=1 n (xi (x; - *)2 i=1
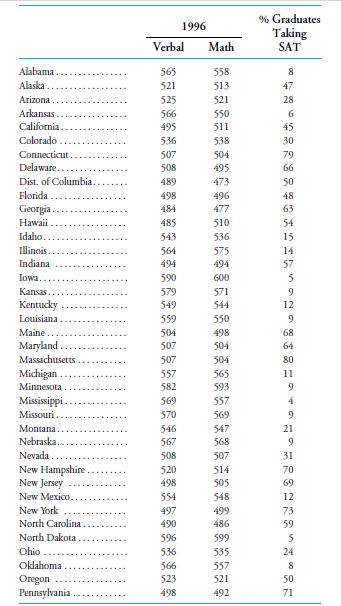
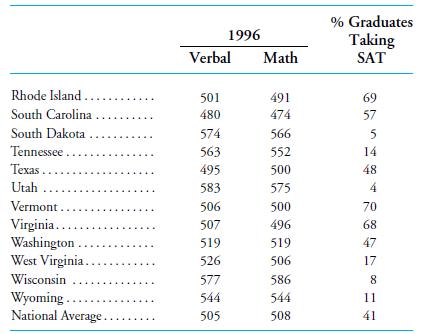
The following table gives the 1996 SAT mean math and verbal scores in each state and the District of Columbia, along with the percentage of the states’ graduating high school students that took the examination. Use data relating to the first 20 locations listed (Alabama to Maine) to develop a
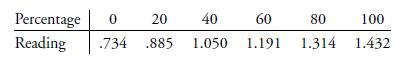
Infrared spectroscopy is often used to determine the natural rubber content of mixtures of natural and synthetic rubber. For mixtures of known percentages, the infrared spectroscopy gave the following readings:If a new mixture gives an infrared spectroscopy reading of 1.15, estimate its percentage
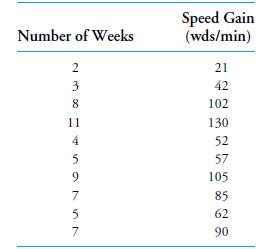
The following data indicate the gain in reading speed versus the number of weeks in the program of 10 students in a speed-reading program.(a) Plot a scatter diagram to see if a linear relationship is indicated.(b) Find the least squares estimates of the regression coefficients.(c) Estimate the
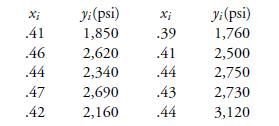
The following data indicate the relationship between x, the specific gravity of a wood sample, and Y , its maximum crushing strength in compression parallel to the grain.(a) Plot a scatter diagram. Does a linear relationship seem reasonable?(b) Estimate the regression coefficients.(c) Predict the
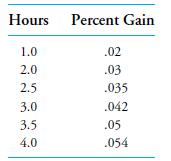
The corrosion of a certain metallic substance has been studied in dry oxygen at 500 degrees centigrade. In this experiment, the gain in weight after various periods of exposure was used as a measure of the amount of oxygen that had reacted with the sample. Here are the data:(a) Plot a scatter
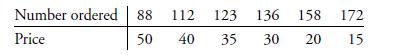
The following data relate the number of units of a good that were ordered as a function of the price of the good at six different locations.How many units do you think would be ordered if the price were 25? Number ordered 88 112 123 136 158 172 Price 50 40 35 30 20 15
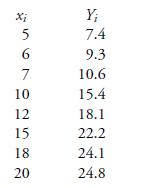
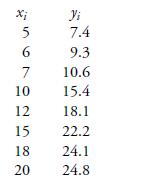
The following data relate x, the moisture of a wet mix of a certain product, to Y , the density of the finished product.(a) Draw a scatter diagram.(b) Fit a linear curve to the data. 12 15 25 567025 Y; 7.4 9.3 10.6 10 15.4 18.1 22.2 18 24.1 20 24.8
A steel company is planning to produce cold reduced sheet steel consisting of .15 percent copper at an annealing temperature of 1,150 (degrees F), and is interested in estimating the average (Rockwell 30-T) hardness of a sheet. To determine this, they have collected the data shown in Table 9.6 on
The diameter of a tree at its breast height is influenced by many factors.The data in Table 9.5 relate the diameter of a particular type of eucalyptus tree to its age, average rainfall at its site, site’s elevation, and the wood’s mean specific gravity. (The data come from R. G. Skolmen, 1975,
For the data of Example 9.10a, we computed that SSR = 34.12. Since n = 8, k = 2, the estimate of σ2 is 34.12/5 = 6.824. ■
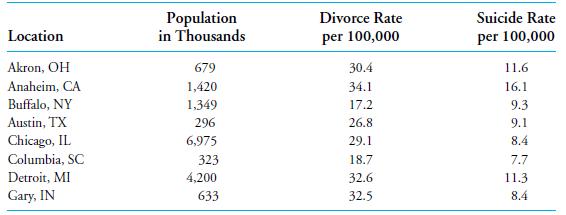
The data in Table 9.4 relate the suicide rate to the population size and the divorce rate at eight different locations.Fit a multiple linear regression model to these data. That is, fit a model of the form Y = β0 + β1x1 + β2x2 + e where Y is the suicide rate, x1 is the population, and x2 is the
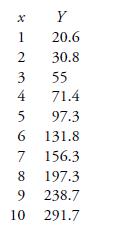
Fit a polynomial to the following data. x Y 1 20.6 2 30.8 3 55 4 71.4 5 97.3 6 131.8 7 156.3 8 197.3 9 238.7 10 291.7
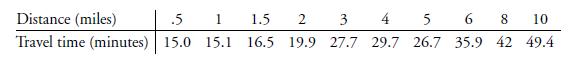
The following data represent travel times in a downtown area of a certain city. The independent, or input, variable is the distance to be traveled.Assuming a linear relationship of the form Y = α + βx + e between Y , the travel time, and x, the distance, how should we estimate α and β?To
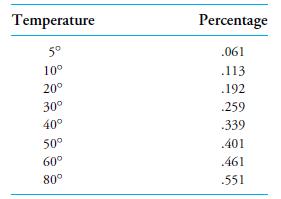
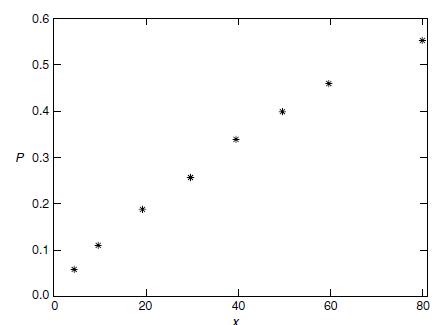
The following table gives the percentages of a chemical that were used up when an experiment was run at various temperatures (in degrees Celsius).Use it to estimate the percentage of the chemical that would be used up if the experiment were to be run at 350 degrees. Temperature Percentage 5 .061 10
Using the data of Example 9.4c, determine a 95 percent confidence interval for the average height of all males whose fathers are 68 inches tall.
Derive a 95 percent confidence interval estimate of β in Example 9.4a.
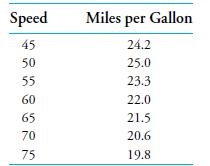
An individual claims that the fuel consumption of his automobile does not depend on how fast the car is driven. To test the plausibility of this hypothesis, the car was tested at various speeds between 45 and 70 miles per hour. The miles per gallon attained at each of these speeds was determined,
The following data relate x, the moisture of a wet mix of a certain product, to Y, the density of the finished product.Fit a linear curve to these data. Also determine SSR. 7 *5 5630258 10 Yi 7.4 9.3 10.6 15.4 12 18.1 15 22.2 18 24.1 20 24.8
A researcher wants to analyze the average yearly increase in a stock over a 20-year period. To do so, she plans to randomly choose 100 stocks from the listing of current stocks, discarding any that were not in existence 20 years ago.She will then compare the current price of each stock with its
A scientist looking into the effect of smoking on heart disease has chosen a large random sample of smokers and of nonsmokers. She plans to study these two groups for 5 years to see if the number of heart attacks among the members of the smokers’ group is significantly greater than the number
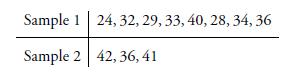
For the following data, sample 1 is from a Poisson distribution with mean λ1 and sample 2 is from a Poisson distribution with mean λ2. Test the hypothesis thatλ1 = λ2. Sample 1 24, 32, 29, 33, 40, 28, 34, 36 Sample 2 42, 36, 41
In 1995, the Fermi Laboratory announced the discovery of the top quark, the last of six quarks predicted by the “standard model of physics.” The evidence for its existence was statistical in nature and involved signals created when antiprotons and protons were forced to collide. In a Physical
Test the hypothesis, at the 5 percent level of significance, that the yearly number of earthquakes felt on a certain island has mean 52 if the readings for the past 8 years are 46, 62, 60, 58, 47, 50, 59, 49. Assume an underlying Poisson distribution and give an explanation to justify this
In the 1970s, the U.S. Veterans Administration (Murphy, 1977) conducted an experiment comparing coronary artery bypass surgery with medical drug therapy as treatments for coronary artery disease. The experiment involved 596 patients, of whom 286 were randomly assigned to receive surgery, with the
The following data refer to Larry Bird’s results when shooting a pair of free throws in basketball.During two consecutive seasons in theNational Basketball Association, Bird shot a pair of free throws on 338 occasions. On 251 occasions he made both shots; on 34 occasions he made the first shot
Patients suffering from cancer must often decide whether to have their tumors treated with surgery or with radiation. A factor in their decision is the 5-year survival rates for these treatments. Surprisingly, it has been found that patients’decisions often seem to be affected by whether they are
Use the approximate test given in Problem 63 on the data of Problem 60.
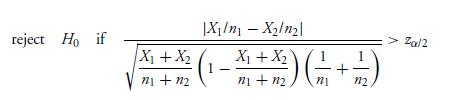
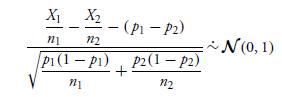
Let X1 and X2 be binomial random variables with respective parameters n1, p1 and n2, p2. Show that when n1 and n2 are large, an approximate level α test of H0 : p1 = p2 versus H1 : p1 = p2 is as follows:Hint: (a) Argue first that when n1 and n2 are largewhere ∼˙ means “approximately has the
Verify that Equation 8.6.5 follows from Equation 8.6.4.
Let X1 denote a binomial random variable with parameters (n1, p1) and X2 an independent binomial random variable with parameters (n2, p2). Develop a test, using the same approach as in the Fisher-Irwin test, of H0 : p1 ≤ p2 versus the alternative H1 : p1 > p2
In a study of the effect of two chemotherapy treatments on the survival of patients with multiple myeloma, each of 156 patients was equally likely to be given either one of the two treatments. As reported by Lipsitz, Dear, Laird, and Molenberghs in a 1998 paper in Biometrics, the result of this was
Do Problem 58 by using a test based on the normal approximation to the binomial.
A standard drug is known to be effective in 75 percent of the cases in which it is used to treat a certain infection. A new drug has been developed and has been found to be effective in 42 cases out of 50. Based on this, would you accept, at the 5 percent level of significance, the hypothesis that
An ambulance service claims that at least 45 percent of its calls involve lifethreatening emergencies. To check this claim, a random sample of 200 calls was selected from the service’s files. If 70 of these calls involved life-threatening emergencies, is the service’s claim believable at the(a)
According to the U.S. Bureau of the Census, 25.5 percent of the population of those age 18 or over smoked in 1990. A scientist has recently claimed that this percentage has since increased, and to prove her claim she randomly sampled 500 individuals from this population. If 138 of them were
Three independent news services are running a poll to determine if over half the population supports an initiative concerning limitations on driving automobiles in the downtown area. Each wants to see if the evidence indicates that over half the population is in favor. As a result, all three
A standard drug is known to be effective in 72 percent of the cases in which it is used to treat a certain infection. A new drug has been developed and testing has found it to be effective in 42 cases out of 50. Is this strong enough evidence to prove that the new drug is more effective than the
In the study of Problem 52, it also resulted that 119 from the aspirin group and 98 from the control group suffered strokes. Are these numbers significant to show that taking aspirin changes the probability of having a stroke?
In a famous experiment to determine the efficacy of aspirin in preventing heart attacks, 22,000 healthy middle-aged men were randomly divided into two equal groups, one of which was given a daily dose of aspirin and the other a placebo that looked and tasted identical to the aspirin. The experiment
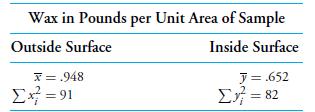
The amount of surface wax on each side of waxed paper bags is believed to be normally distributed. However, there is reason to believe that there is greater variation in the amount on the inner side of the paper than on the outside. A sample of 75 observations of the amount of wax on each side of
If X1, . . . , Xn is a sample from a normal population with variance σ2 x , and Y1, . . . , Yn is an independent sample from normal population with variance σ2 y , develop a significance level α test of H0 : σ2 x < σ2 y versus H1 : σ2 x > σ2 y
In Problem 31, test the hypothesis that the populations have the same variances.
The production of large electrical transformers and capacitators requires the use of polychlorinated biphenyls (PCBs), which are extremely hazardous when released into the environment. Two methods have been suggested to monitor the levels of PCB in fish near a large plant. It is believed that each
A pharmaceutical house produces a certain drug item whose weight has a standard deviation of .5 milligrams. The company’s research team has proposed a new method of producing the drug.However, this entails some costs and will be adopted only if there is strong evidence that the standard deviation
A gun-like apparatus has recently been designed to replace needles in administering vaccines. The apparatus can be set to inject different amounts of the serum, but because of random fluctuations the actual amount injected is normally distributed with a mean equal to the setting and with an unknown
In Problem 44, explain how the test would be modified if the population mean μwere known in advance.
If X1, . . . , Xn is a sample from a normal population having unknown parametersμ and σ2, devise a significance level α test of H0 = σ2 ≤ σ2 0versus the alternative H1 = σ2 > σ2 0for a given positive value σ2 0 .
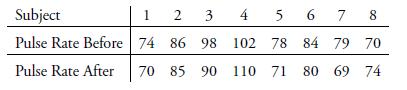
A question of medical importance is whether jogging leads to a reduction in one’s pulse rate. To test this hypothesis, 8 nonjogging volunteers agreed to begin a 1-month jogging program. After the month their pulse rates were determined and compared with their earlier values. If the data are as
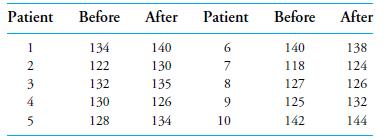
Ten pregnant women were given an injection of pitocin to induce labor. Their systolic blood pressures immediately before and after the injection were:Do the data indicate that injection of this drug changes blood pressure? Patient Before After Patient Before After I 134 140 2 122 130 3 132 135 4
To verify the hypothesis that blood lead levels tend to be higher for children whose parents work in a factory that uses lead in the manufacturing process, researchers examined lead levels in the blood of 33 children whose parents worked in a battery manufacturing factory (Morton, D., Saah, A.,
Sample weights (in pounds) of newborn babies born in two adjacent counties in western Pennsylvania yielded the following data.n = 53, m = 44 X = 6.8, Y = 7.2 S2 = 5.2, S2 = 4.9 Consider a test of the hypothesis that the mean weight of newborns is the same in both counties. What is the resulting
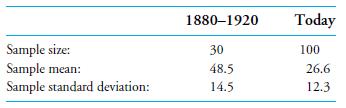
The following data summary was obtained froma comparison of the lead content of human hair removed from adult individuals that had died between 1880 and 1920 with the lead content of present-day adults. The data are in units of micrograms, equal to one-millionth of a gram.(a) Do the above data
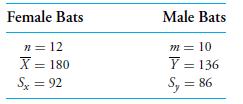
To learn about the feeding habits of bats, 22 bats were tagged and tracked by radio.Of these 22 bats, 12 were female and 10 were male. The distances flown (in meters)between feedings were noted for each of the 22 bats, and the following summary statistics were obtained.Test the hypothesis that the
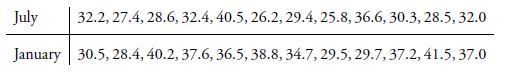
A study was instituted to learn how the diets of women changed during the winter and the summer. A random group of 12 womenwere observed during the month of July and the percentage of eachwoman’s calories that came fromfat was determined.Similar observations were made on a different randomly
In a certain experimental laboratory, a method A for producing gasoline from crude oil is being investigated. Before completing experimentation, a new method B is proposed. All other things being equal, it was decided to abandon A in favor of B only if the average yield of the latter was clearly
A professor claims that the average starting salary of industrial engineering graduating seniors is greater than that of civil engineering graduates. To study this claim, samples of 16 industrial engineers and 16 civil engineers, all of whom graduated in 2006, were chosen and sample members were
In a 1943 experiment (Whitlock and Bliss, “A Bioassay Technique for Antihelminthics,”Journal of Parasitology, 29, pp. 48–58) 10 albino rats were used to study the effectiveness of carbon tetrachloride as a treatment for worms. Each rat received an injection of worm larvae. After 8 days, the
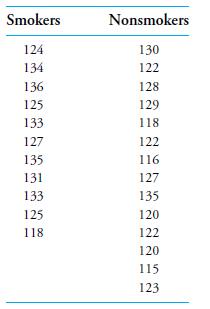
Twenty-five men between the ages of 25 and 30, who were participating in a wellknown heart study carried out in Framingham, Massachusetts, were randomly selected. Of these, 11 were smokers and 14 were not. The following data refer to readings of their systolic blood pressure.Use these data to test
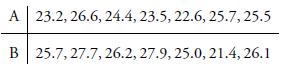
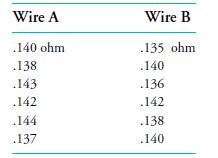
It is argued that the resistance of wire A is greater than the resistance of wire B.You make tests on each wire with the following results.What conclusion can you draw at the 10 percent significance level? Explain what assumptions you are making.In Problems 33 through 40, assume that the population
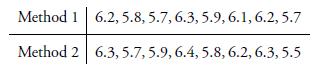
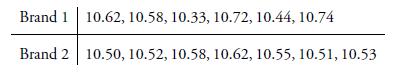
The viscosity of two different brands of car oil is measured and the following data resulted:Test the hypothesis that the mean viscosity of the two brands is equal, assuming that the populations have normal distributions with equal variances. Brand 1 10.62, 10.58, 10.33, 10.72, 10.44, 10.74 Brand 2
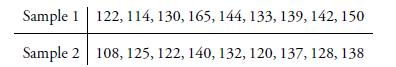
The data below give the lifetimes in hundreds of hours of samples of two types of electronic tubes. Past lifetime data of such tubes have shown that they can often be modeled as arising from a lognormal distribution. That is, the logarithms of the data are normally distributed. Assuming that
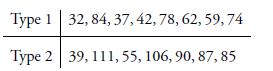
The following are the values of independent samples from two different populations.Let μ1 and μ2 be the respective means of the two populations. Find the p-value of the test of the null hypothesis H0 : μ1 ≤ μ2 versus the alternative H1 : μ1 > μ2 when the population standard deviations
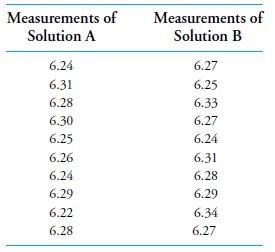
A method for measuring the pH level of a solution yields a measurement value that is normally distributed with a mean equal to the actual pH of the solution and with a standard deviation equal to .05. An environmental pollution scientist claims that two different solutions come from the same
A sample of 10 fish were caught at lake A and their PCB concentrations were measured using a certain technique. The resulting data in parts per million were Lake A: 11.5, 10.8, 11.6, 9.4, 12.4, 11.4, 12.2, 11, 10.6, 10.8 In addition, a sample of 8 fish were caught at lake B and their levels of PCB
A manufacturer of capacitors claims that the breakdown voltage of these capacitors has a mean value of at least 100 V. A test of 12 of these capacitors yielded the following breakdown voltages:96, 98, 105, 92, 111, 114, 99, 103, 95, 101, 106, 97 Do these results prove the manufacturer’s claim? Do
It is claimed that a certain type of bipolar transistor has a mean value of current gain that is at least 210. A sample of these transistors is tested. If the sample mean value of current gain is 200 with a sample standard deviation of 35, would the claim be rejected at the 5 percent level of
A company supplies plastic sheets for industrial use. A new type of plastic has been produced and the company would like to claim that the average stress resistance of this new product is at least 30.0, where stress resistance is measured in pounds per square inch (psi) necessary to crack the
An oil company claims that the sulfur content of its diesel fuel is at most .15 percent. To check this claim, the sulfur contents of 40 randomly chosen samples were determined; the resulting sample mean and sample standard deviation were.162 and .040. Using the 5 percent level of significance, can
Use the data of Example 2.3i of Chapter 2 to test the null hypothesis that the average noise level directly outside of Grand Central Station is less than or equal to 80 decibels.
A producer specifies that the mean lifetime of a certain type of battery is at least 240 hours. A sample of 18 such batteries yielded the following data.237 242 232 242 248 230 244 243 254 262 234 220 225 236 232 218 228 240 Assuming that the life of the batteries is approximately normally
A car is advertised as having a gas mileage rating of at least 30 miles/gallon in highway driving. If the miles per gallon obtained in 10 independent experiments are 26, 24, 20, 25, 27, 25, 28, 30, 26, 33, should you believe the advertisement?What assumptions are you making?
Use the results of a Sunday’s worth of major league baseball scores to test the hypothesis that the average number of runs scored by winning teams is at least 5.6.Use the 5 percent level of significance.
Use the results of a Sunday’s worth of NFL professional football games to test the hypothesis that the average number of points scored by winning teams is less than or equal to 28. Use the 5 percent level of significance.
A medical scientist believes that the average basal temperature of (outwardly)healthy individuals has increased over time and is now greater than 98.6 degrees Fahrenheit (37 degrees Celsius). To prove this, she has randomly selected 100 healthy individuals. If their mean temperature is 98.74 with a
Suppose that team A and team B are to play a National Football League game and that team A is favored by f points. Let S(A) and S(B) denote the scores of teams A and B, and let X = S(A) − S(B) − f . That is, X is the amount by which team A beats the point spread. It has been claimed that the
The mean response time of a species of pigs to a stimulus is .8 seconds. Twentyeight pigs were given 2 oz of alcohol and then tested. If their average response time was 1.0 seconds with a standard deviation of .3 seconds, can we conclude that alcohol affects the mean response time? Use the 5
Twenty years ago, entering male high school students of Central High could do an average of 24 pushups in 60 seconds. To see whether this remains true today, a random sample of 36 freshmen was chosen. If their average was 22.5 with a sample standard deviation of 3.1, can we conclude that the mean
Showing 1700 - 1800
of 5712
First
11
12
13
14
15
16
17
18
19
20
21
22
23
24
25
Last
Step by Step Answers