New Semester
Started
Get
50% OFF
Study Help!
--h --m --s
Claim Now
Question Answers
Textbooks
Find textbooks, questions and answers
Oops, something went wrong!
Change your search query and then try again
S
Books
FREE
Study Help
Expert Questions
Accounting
General Management
Mathematics
Finance
Organizational Behaviour
Law
Physics
Operating System
Management Leadership
Sociology
Programming
Marketing
Database
Computer Network
Economics
Textbooks Solutions
Accounting
Managerial Accounting
Management Leadership
Cost Accounting
Statistics
Business Law
Corporate Finance
Finance
Economics
Auditing
Tutors
Online Tutors
Find a Tutor
Hire a Tutor
Become a Tutor
AI Tutor
AI Study Planner
NEW
Sell Books
Search
Search
Sign In
Register
study help
business
statistics for engineers and scientists
Introduction To Probability And Statistics For Engineers And Scientists 6th Edition Sheldon M Ross - Solutions
51. Suppose distinct values are written on each of three cards, which are then randomly given the designations A, B, and C. The values on cards A and B are then compared. What is the probability that the smaller of these values is also smaller than the value on card C?
50. There is a 60 percent chance that the event A will occur. If A does not occur, there is a 10 percent chance that B will occur. What is the probability that at least one of the events A or B occur?
49. Twelve percent of all US households are in California. A total of 3.3 percent of all US households earn over $250, 000 per year, while a total of 6.3 percent of California households earn over $250, 000 per year. If a randomly chosen US household earns over $250, 000 per year, what is the
48. Two percent of women of age 45 who participate in routine screening have breast cancer. Ninety percent of those with breast cancer have positive mammographies. Ten percent of the women who do not have breast cancer will also have positive mammographies. Given a woman has a positive mammography,
47. Let A, B, C be events such that P(A) = .2, P(B) = .3, P(C) = .4.Find the probability that at least one of the events A and B occurs ifa. A and B are mutually exclusive;b. A and B are independent.Find the probability that all of the events A, B, C occur ifa. A, B, C are independent;b. A, B, C
46. Suppose that distinct integer values are written on each of 3 cards. Suppose you are to be offered these cards in a random order. When you are offered a card you must immediately either accept it or reject it. If you accept a card, the process ends. If you reject a card, then the next card (if
45. In a 7-game series played with two teams, the first team to win a total of 4 games is the winner. Suppose that each game played is independently won by teamA with probability p.a. Given that one team leads 3 to 0, what is the probability that it is team A that is leading?b. Given that one team
44. Although both my parents have brown eyes, I have blue eyes. What is the probability that my sister has blue eyes? (As stated in Problem 42, an individual who receives a blue-eyed gene from each parent will have blue eyes, whereas one who receives one blue-eyed and one brown-eyed gene will have
43. Three prisoners are informed by their jailer that one of them has been chosen at random to be executed, and the other two are to be freed. Prisoner A asks the jailer to tell him privately which of his fellow prisoners will be set free, claiming that there would be no harm in divulging this
42. A certain organism possesses a pair of each of 5 different genes (which we will designate by the first 5 letters of the English alphabet). Each gene appears in 2 forms (which we designate by lowercase and capital letters). The capital letter will be assumed to be the dominant gene in the sense
41. A parallel system functions whenever at least one of its components works. Consider a parallel system of n components, and suppose that each component independently works with probability 1 2 . Find the conditional probability that component 1 works, given that the system is functioning.
40. Suppose that n independent trials, each of which results in any of the outcomes 0, 1, or 2, with respective probabilities .3, .5, and .2, are performed.Find the probability that both outcome 1 and outcome 2 occur at least once. (Hint: Consider the complementary probability.)
39. Five independent flips of a fair coin are made. Find the probability thata. the first three flips are the same;b. either the first three flips are the same, or the last three flips are the same;c. there are at least two heads among the first three flips, and at least two tails among the last
38. An engineering system consisting of n components is said to be a k-out-of-n system (k ≤ n) if the system functions if and only if at least k of the n components function. Suppose that all components function independently of each other.a. If the ith component functions with probability Pi, i
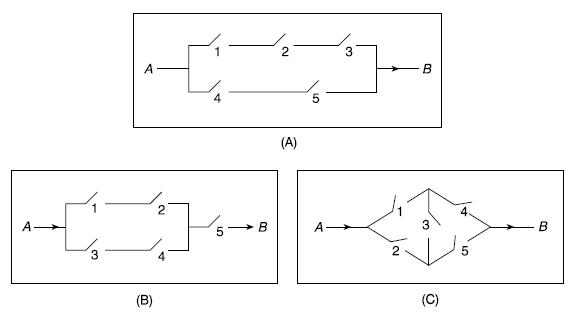
37. The probability of the closing of the ith relay in the circuits shown is given by pi, i =1, 2, 3, 4, 5. If all relays function independently, what is the probability that a current flows between A and B for the respective circuits? A- 3. A 2 5 (B) 2 (A) 5 3 B A 0 B
36. A pair of fair dice is rolled. Let E denote the event that the sum of the dice is equal to 7.a. Show that E is independent of the event that the first die lands on 4.b. Show that E is independent of the event that the second die lands on 3.
35. Suppose that an insurance company classifies people into one of three classes — good risks, average risks, and bad risks. Their records indicate that the probabilities that good, average, and bad risk persons will be involved in an accident over a 1-year span are, respectively, .05, .15, and
34. Prostate cancer is the most common type of cancer found in males. As an indicator of whether a male has prostate cancer, doctors often perform a test that measures the level of the PSA protein (prostate specific antigen)that is produced only by the prostate gland. Although higher PSA levels are
33. Each of 2 cabinets identical in appearance has 2 drawers. Cabinet A contains a silver coin in each drawer, and cabinet B contains a silver coin in one of its drawers and a gold coin in the other. A cabinet is randomly selected, one of its drawers is opened, and a silver coin is found. What is
32. Each of 2 balls is painted black or gold and then placed in an urn. Suppose that each ball is colored black with probability 1 2 , and that these events are independent.a. Suppose that you obtain information that the gold paint has been used (and thus at least one of the balls is painted gold).
31. A total of 600 of the 1000 people in a retirement community classify themselves as Republicans, while the others classify themselves as Democrats. In a local election in which everyone voted, 60 Republicans voted for the Democratic candidate, and 50 Democrats voted for the Republican candidate.
30. Two balls, each equally likely to be colored either red or blue, are put in an urn. At each stage one of the balls is randomly chosen, its color is noted, and it is then returned to the urn. If the first two balls chosen are colored red, what is the probability thata. both balls in the urn are
29. You ask your neighbor to water a sickly plant while you are on vacation.Without water it will die with probability .8; with water it will die with probability .15. You are 90 percent certain that your neighbor will remember to water the plant.a. What is the probability that the plant will be
28. A red die, a blue die, and a yellow die (all six-sided) are rolled. We are interested in the probability that the number appearing on the blue die is less than that appearing on the yellow die which is less than that appearing on the red die. (That is, if B (R) [Y] is the number appearing on
27. There are two local factories that produce microwaves. Each microwave produced at factory A is defective with probability .05, whereas each one produced at factory B is defective with probability .01. Suppose you purchase two microwaves that were produced at the same factory, which is equally
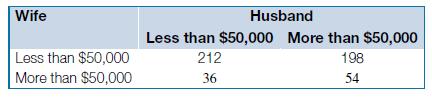
26. A total of 500 married working couples were polled about their annual salaries, with the following information resulting.Thus, for instance, in 36 of the couples the wife earned more and the husband earned less than $50,000. If one of the couples is randomly chosen, what isa. the probability
25. Fifty-two percent of the students at a certain college are females. Five percent of the students in this college are majoring in computer science.Two percent of the students are women majoring in computer science. If a student is selected at random, find the conditional probability thata. this
24. A couple has 2 children. What is the probability that both are girls if the eldest is a girl?
23. Of three cards, one is painted red on both sides; one is painted black on both sides; and one is painted red on one side and black on the other.A card is randomly chosen and placed on a table. If the side facing up is red, what is the probability that the other side is also red?
22. The sample mean of the annual salaries of a group of 100 accountants who work at a large accounting firm is $130,000 with a sample standard deviation of $20,000. If a member of this group is randomly chosen, what can we say abouta. the probability that his or her salary is between $90,000
21. There is a 60 percent chance that the event A will occur. If A does not occur, then there is a 10 percent chance that B will occur.a. What is the probability that at least one of the events A or B occurs?b. If A is the event that the democratic candidate wins the presidential election in 2012
20. Suppose that distinct integer values are written on each of 3 cards. These cards are then randomly given the designations A, B, and C. The values on cards A and B are then compared. If the smaller of these values is then compared with the value on card C, what is the probability that it is also
19. Consider a set of 23 unrelated people. Because each pair of people shares the same birthday with probability 1/365, and there are 23/2 =253 pairs, why isn’t the probability that at least two people have the same birthday equal to 253/365?
18. A group of 5 boys and 10 girls is lined up in random order—that is, each of the 15! permutations is assumed to be equally likely.a. What is the probability that the person in the 4th position is a boy?b. What about the person in the 12th position?c. What is the probability that a particular
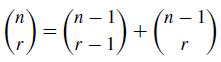
17. Show thatFor a combinatorial argument, consider a set of n items and fix attention on one of these items. Howmany different sets of size r contain this item, and how many do not? n -1 ( ) = ( ) ) + ( " ~ n-1 r
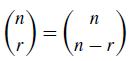
16. Show thatNow present a combinatorial argument for the foregoing by explaining why a choice of r items from a set of size n is equivalent to a choice of n−r items from that set. ("-")=(0)
15. Calculate (...). (9)-
14. Show that the probability that exactly one of the events E or F occurs is equal to P(E)+ P(F) −2P(EF ).
13. Prove thata. P(EFc) = P(E)−P(EF )b. P(EcFc) = 1− P(E)−P(F) +P(EF )
12. If P(E)=.9 and P(F)=.9, show that P(EF )≥.8. In general, prove Bonferroni’s inequality, namely that P(EF)≥P(E)+ P(F) −1
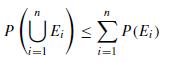
11. Prove Boole’s inequality, namely that P(UE) = P(E) () \i=1 i=1
10. Show that if E⊂F then P(E)≤P(F). (Hint: Write F as the union of two mutually exclusive events, one of them being E.)
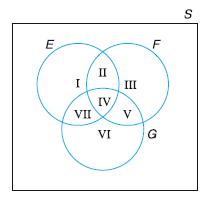
9. For the following Venn diagram, describe in terms of E, F, and G the events denoted in the diagram by the Roman numerals I through VII. E II F S I III IV. VII V VI G
8. Use Venn diagrams (or any other method) to show thata. EF⊂E, E⊂E ∪F;b. if E⊂F then Fc ⊂Ec;c. the commutative laws are valid;d. the associative laws are valid;e. F =FE∪FE c;f. E ∪F =E ∪EcF;g. DeMorgan’s laws are valid.
7. Find simple expressions for the eventsa. E ∪Ec;b. EEc;c. (E ∪F)(E ∪Fc);d. (E ∪F)(Ec ∪F)(E ∪Fc);e. (E ∪F)(F ∪G).
6. Let E, F, G be three events. Find expressions for the events that of E, F, Ga. only E occurs;b. both E and G but not F occur;c. at least one of the events occurs;d. at least two of the events occur;e. all three occur;f. none of the events occurs;g. at most one of them occurs;h. at most two of
5. A system is composed of four components, each of which is either working or failed. Consider an experiment that consists of observing the status of each component, and let the outcome of the experiment be given by the vector (x1, x2, x3, x4) where xi is equal to 1 if component i is working and
4. Two dice are thrown. Let E be the event that the sum of the dice is odd, let F be the event that the first die lands on 1, and let G be the event that the sum is 5. Describe the events EF, E ∪ F, FG, EFc, EFG.
3. Let S = {1, 2, 3, 4, 5, 6, 7}, E = {1, 3, 5, 7}, F = {7, 4, 6}, G = {1, 4}. Finda. EF ;c. EGc;e. Ec(F ∪ G);b. E ∪FG ;d. EF c ∪G;f. EG ∪FG.
2. An experiment consists of tossing a coin three times. What is the sample space of this experiment? Which event corresponds to the experiment resulting in more heads than tails?
1. A box contains three marbles — one red, one green, and one blue. Consider an experiment that consists of taking onemarble from the box, then replacing it in the box and drawing a second marble from the box. Describe the sample space. Repeat for the case in which the second marble is drawn
40.a. How is the Gini index changed if all values are multiplied by a positive constant c?b. Does the Gini index increase, decrease, remain the same, or is it not possible to tell, when a positive constant c is added to all values?
39. Draw the Lorenz curve and compute the Gini index of a group whose annual incomes (in thousands of dollars) are given by the following frequency table.Value Frequency 30 2 50 4 60 5 90 4 100 3 120 2
38. Draw the Lorenz curve and compute the Gini index of a group whose incomes are 25, 32, 60, 40, 38, 50.
37. A recent study yielded a positive correlation between breast-fed babies and scores on a vocabulary test taken at age 6. Discuss the potential difficulties in interpreting the results of this study.
36. In a study of children in grades 2 through 4, a researcher gave each student a reading test. When looking at the resulting data the researcher noted a positive correlation between a student’s reading test score and height. The researcher concluded that taller children read better because they
35. Verify property 4 of the sample correlation coefficient.
34. Verify property 3 of the sample correlation coefficient.
33. A random group of 12 high school juniors were asked to estimate the average number of hours they study each week. The following give these hours along with the student’s grade point average.Hours GPA 6 2.8 14 3.2 3 3.1 22 3.6 9 3.0 11 3.3 12 3.4 5 2.7 18 3.1 24 3.8 15 3.0 17 3.9 Find the
32. If for each of the fifty states we plot the paired data consisting of the average income of residents of the state and the number of foreign-born immigrants who reside in the state, then the data pairs will have a positive correlation. Can we conclude that immigrants tend to have higher incomes
31. A random sample of individuals were rated as to their standing posture.In addition, the numbers of days of back pain each had experienced during the past year were also recorded. Surprisingly to the researcher these data indicated a positive correlation between good posture and number of days
30. The following are the heights and starting salaries of 12 law school classmates whose law school examination scores were roughly the same.Height Salary 64 91 65 94 66 88 67 103 69 77 70 96 72 105 72 88 74 122 74 102 75 90 76 114a. Represent these data in a scatter diagram.b. Find the sample
29. Use the data of Problem 16.a. Compute the sample mean and sample median.b. Are the data approximately normal?c. Compute the sample standard deviation s.d. What percentage of the data fall within ¯x ±1.5s?e. Compare your answer in part (d) to that given by the empirical rule.f. Compare your
28. Would you expect that a histogram of the weights of all the members of a health club would be approximately normal?
27. Do the data in Problem 26 appear to be approximately normal? For parts(c) and (d) of this problem, compare the approximate proportions given by the empirical rule with the actual proportions.
26. The following are the grade point averages of 30 students recently admitted to the graduate program in the Department of Industrial Engineering and Operations Research at the University of California at Berkeley.3.46, 3.72, 3.95, 3.55, 3.62, 3.80, 3.86, 3.71, 3.56, 3.49, 3.96, 3.90, 3.70, 3.61,
25. A chemical engineer desiring to study the evaporation rate of water from brine evaporation beds obtained data on the number of inches of evaporation in each of 55 July days spread over 4 years. The data are given in the following stem and leaf plot, which shows that the smallest data value was
24. The average particulate concentration, in micrograms per cubic meter, was measured in a petrochemical complex at 36 randomly chosen times, with the following concentrations resulting:5, 18, 15, 7, 23, 220, 130, 85, 103, 25, 80, 7, 24, 6, 13, 65, 37, 25, 24, 65, 82, 95, 77, 15, 70, 110, 44, 28,
23. Represent the data of Problem 20 in a box plot.
22. Fill in the missing word or phrase to complete the following sentence,“If a new value is added to a set of numbers, then the sample mean will increase over what it was if the new value is —.”
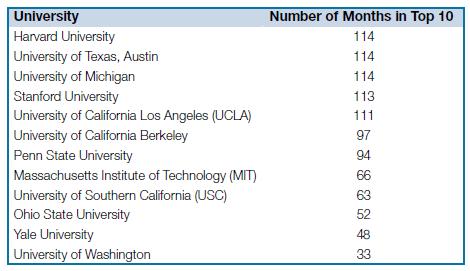
21. The universities having the largest number of months in which they ranked in the top 10 for the number of Google searches over the past 114 months (as of June 2013) are as follows.a. Find the sample mean of the data.b. Find the sample variance of the data.c. Find the sample quartiles of the
20. Find the quartiles of the following ages at death as given in obituaries of the New York Times in the 2 weeks preceding 1 August 2013.92, 90, 92, 74, 69, 80, 94, 98, 65, 96, 84, 69, 86, 91, 88 74, 97, 85, 88, 68, 77, 94, 88, 65, 76, 75, 60 69, 97, 92, 85, 70, 80, 93, 91, 68, 82, 78, 89
19. Use the data of Table 2.5 to find thea. 90 percentile of the average temperature for January;b. 75 percentile of the average temperature for July.
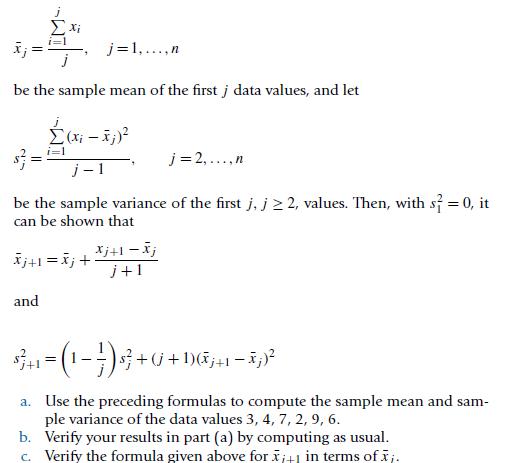
18. A computationally efficient way to compute the sample mean and sample variance of the data set x1, x2, . . . , xn is as follows. Let j=1,...,n be the sample mean of the first j data values, and let (x-x1) j-1 j=2,...,n be the sample variance of the first j, j 2, values. Then, with s = 0, it
17. An experiment measuring the percent shrinkage on drying of 50 clay specimens produced the following data:18.2 21.2 23.1 18.5 15.6 20.8 19.4 15.4 21.2 13.4 16.4 18.7 18.2 19.6 14.3 16.6 24.0 17.6 17.8 20.2 17.4 23.6 17.5 20.3 16.6 19.3 18.5 19.3 21.2 13.9 20.5 19.0 17.6 22.3 18.4 21.2 20.4 21.4
16. The following data represent the lifetimes (in hours) of a sample of 40 transistors:112, 121, 126, 108, 141, 104, 136, 134 121, 118, 143, 116, 108, 122, 127, 140 113, 117, 126, 130, 134, 120, 131, 133 118, 125, 151, 147, 137, 140, 132, 119 110, 124, 132, 152, 135, 130, 136, 128a. Determine the
15. Suppose you are given the average pay of all working people in each of the 50 states of the United States.a. Do you think that the sample mean of the averages for the 50 states will equal the value given for the entire United States?b. If the answer to part (a) is no, explain what other
14. The sample mean and sample variance of five data values are, respectively,¯x= 104 and s2 = 16. If three of the data values are 102, 100, 105, what are the other two data values?
13. The following are the percentages of ash content in 12 samples of coal found in close proximity:9.2, 14.1, 9.8, 12.4, 16.0, 12.6, 22.7, 18.9, 21.0, 14.5, 20.4, 16.9 Find thea. sample mean, andb. sample standard deviation of these percentages.
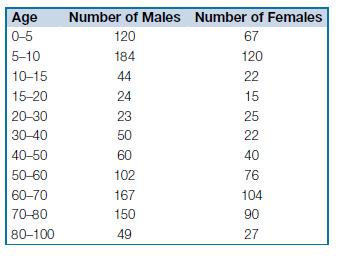
12. The following table gives the number of pedestrians, classified according to age group and sex, killed in fatal road accidents in England in 1922.a. Approximate the sample means of the ages of the males.b. Approximate the sample means of the ages of the females.c. Approximate the quartiles of
11. The sample mean of the initial 99 values of a data set consisting of 198 values is equal to 120, whereas the sample mean of the final 99 values is equal to 100. What can you conclude about the sample mean of the entire data seta. Repeat when “sample mean” is replaced by “sample
10. A total of 100 people work at company A, whereas a total of 110 work at company B. Suppose the total employee payroll is larger at company A than at company B.a. What does this imply about the median of the salaries at company A with regard to the median of the salaries at company B?b. What
9. Benford’s law, also called the first-digit law, is the observation that the first digits in many real-life sets of numerical data do not occur in equal proportions, but rather are biased towards the smaller numbers. More precisely, it states that the proportion of the data whose first non-zero
8. The sample mean of the weights of the adult women of town A is larger than the sample mean of the weights of the adult women of town B.Moreover, the sample mean of the weights of the adult men of town A is larger than the sample mean of the weights of the adult men of town B. Can we conclude
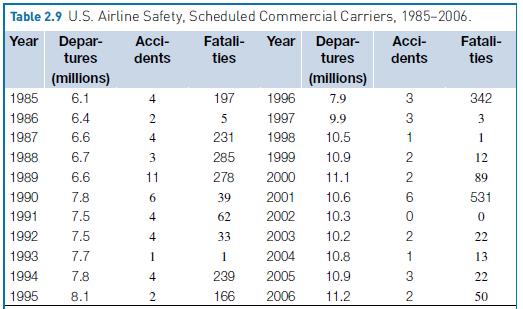
7. (Use the table from Problem 6.)a. Represent the number of yearly airline fatalities in a histogram.b. Represent the number of yearly airline fatalities in a stem and leaf plot.c. Find the sample mean of the number of yearly airline fatalities.d. Find the sample median of the number of yearly
6. Table 2.9 gives the number of commercial airline accidents and the total number of resulting fatalities in the United States in the years from 1985 to 2006.a. Represent the number of yearly airline accidents in a frequency table.b. Give a frequency polygon graph of the number of yearly airline
5. The following is a frequency table of daily travel times (in minutes):a. How many days are reported in the frequency table?b. Find the sum of the travel times of all those days.Travel time Frequency 15 6 18 5 22 4 23 3 24 4 25 2 26 4 32 3 36 1 48 1
4. Choose a book or article and count the number of words in each of the first 100 sentences. Present the data in a stem and leaf plot. Now choose another book or article, by a different author, and do the same. Do the two stem and leaf plots look similar? Do you think this could be a viable method
3. The following are the estimated oil reserves, in billions of barrels, for four regions in the Western Hemisphere:United States 38.7 South America 22.6 Canada 8.8 Mexico 60.0 Represent these data in a pie chart.
2. Explain how a pie chart can be constructed. If a data value had relative frequency r, at what angle would the lines defining its sector meet?
1. The following is a sample of prices, rounded to the nearest cent, charged per gallon of standard unleaded gasoline in the San Francisco Bay area in June 1997.3.88, 3.90, 3.93, 3.90, 3.93, 3.96, 3.88, 3.94, 3.96, 3.88, 3.94, 3.99, 3.98 Represent these data ina. a frequency table;b. a relative
10. Based on Graunt’s mortality table:a. What proportion of people survived to age 6?b. What proportion survived to age 46?c. What proportion died between the ages of 6 and 36?
9. Suppose you were a seller of annuities in 1662 when Graunt’s book was published. Explain how you would make use of his data on the ages at which people were dying.
8. The London bills of mortality listed 12,246 deaths in 1658. Supposing that a survey of London parishes showed that roughly 2 percent of the population died that year, use Graunt’s method to estimate London’s population in 1658.
7. Critique Graunt’s method for estimating the population of London.What implicit assumption is he making?
6. An article reported that a survey of clothing worn by pedestrians killed at night in traffic accidents revealed that about 80 percent of the victims were wearing dark-colored clothing and 20 percent were wearing lightcolored clothing. The conclusion drawn in the article was that it is safer to
5. A university plans on conducting a survey of its recent graduates to determine information on their yearly salaries. It randomly selected 200 recent graduates and sent them questionnaires dealing with their present jobs.Of these 200, however, only 86 were returned. Suppose that the average of
4. To determine the proportion of people in your town who are smokers, it has been decided to poll people at one of the following local spots:a. the pool hall;b. the bowling alley;c. the shopping mall;d. the library.Which of these potential polling places would most likely result in a reasonable
3. A researcher is trying to discover the average age at death for people in the United States today. To obtain data, the obituary columns of the New York Times are read for 30 days, and the ages at death of people in the United States are noted. Do you think this approach will lead to a
2. The approach used in Problem 1(e) led to a disastrous prediction in the 1936 presidential election, in which Franklin Roosevelt defeated Alfred Landon by a landslide. A Landon victory had been predicted by the Literary Digest. The magazine based its prediction on the preferences of a sample of
Showing 3200 - 3300
of 5712
First
26
27
28
29
30
31
32
33
34
35
36
37
38
39
40
Last
Step by Step Answers