

Question: Recall the data about the Burger King menu items in Chapter 7. Here are boxplots of protein content comparing items that contain meat with those
Recall the data about the Burger King menu items in Chapter 7. Here are boxplots of protein content comparing items that contain meat with those that do not. The plot on the right graphs log(Protein). Which of the goals of re-expression does this illustrate?
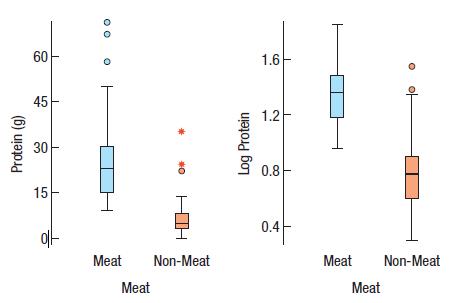
Protein (g) 60 45 30 15 T 00 Meat Meat #0 HIH Non-Meat Log Protein 1.6 1.2 0.8 4. 0.4 Meat Non-Meat Meat
Step by Step Solution
3.51 Rating (161 Votes )
There are 3 Steps involved in it
This plot illustrates the goal of reexpression to transform the data in order to make the distributi... View full answer

Get step-by-step solutions from verified subject matter experts