

Draw frequency response curves for the response of the disk at the end of the shaft in
Question:
Draw frequency response curves for the response of the disk at the end of the shaft in Example 10.3. Plot the curves for \(\beta=0.5, \beta=2\), and \(\beta=20.0\).
Example 10.3:
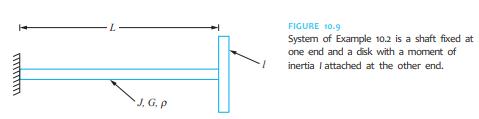
The thin disk of Example 10.2 and Figure 10.9 is subject to a harmonic torque,
\[
T(t)=T_0 \sin \omega t
\]
Determine the steady-state response of the system.
Example 10.2:
The circular shaft of Figure 10.9 is fixed at x = 0 and has a thin disk of mass moment of inertia I attached at x = 1. Determine the natural frequencies for this system, identify the orthogonality condition satisfied by the mode shapes, and determine the normalized mode shapes
Step by Step Answer:

This question has not been answered yet.
You can Ask your question!
Related Book For 
Question Posted:
