

An instructor collected data on the number of states that 50 students in her class had visited
Question:
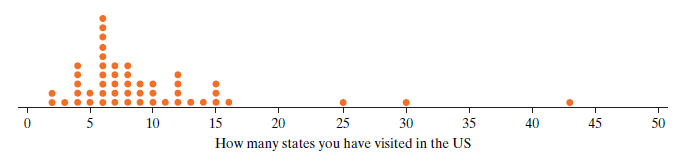
a. Use the dotplot to find and report the median value for the number of states visited by the students in this study.
b. Use the dotplot to determine the lower and upper quartile values and the inter-quartile range for the number of states visited by the students in this study.
c. Would the mean value for these data be smaller than, larger than, or the same as the median, as reported in part (a)? Explain your reasoning.
Fantastic news! We've Found the answer you've been seeking!
Step by Step Answer:
a 25th value is 7 and 26th ...View the full answer

Answered By
Mehwish Aziz
What I have learnt in my 8 years experience of tutoring is that you really need to have a friendly relationship with your students so they can come to you with their queries without any hesitation. I am quite hardworking and I have strong work ethics. Since I had never been one of those who always top in the class and always get A* no matter what, I can understand the fear of failure and can relate with my students at so many levels. I had always been one of those who had to work really hard to get decent grades. I am forever grateful to some of the amazing teachers that I have had who made learning one, and owing to whom I was able to get some extraordinary grades and get into one of the most prestigious universities of the country. Inspired by those same teachers, I am to be like one of them - who never gives up on her students and always believe in them!
3+ Reviews
10+ Question Solved
Related Book For 

Introduction To Statistical Investigations
ISBN: 9781118172148
1st Edition
Authors: Beth L.Chance, George W.Cobb, Allan J.Rossman Nathan Tintle, Todd Swanson Soma Roy
Question Posted:
