

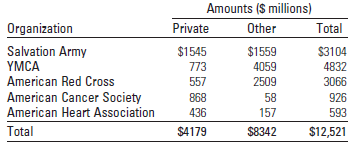
Question: Charitable organizations count on support from both private donations and other sources. Here are the sources of income in a recent year for several well-known
a. Construct a stacked bar chart to display the sources of income given in the table.
b. Construct two comparative pie charts to display the sources of income given in the table.
c. Write a short paragraph summarizing the information that can be gained by looking at these graphs. Which of the two types of comparative graphs is more effective?
Amounts (S millions) Organization Private Other Total Salvation Army YMCA American Red Cross $1545 $1559 $3104 773 4059 4832 2509 557 3066 American Cancer Society American Heart Association 868 58 926 436 157 593 Total $4179 $8342 $12,521
Step by Step Solution
3.36 Rating (159 Votes )
There are 3 Steps involved in it
a b c The stacked bar chart and the comparative ... View full answer

Get step-by-step solutions from verified subject matter experts