

Fit the data from problem 11.11 to the following model by regression over all points, and compare
Question:
Fit the data from problem 11.11 to the following model by regression over all points, and compare with the experimental data on the same plot, using
(a) The Scatchard-Hildebrand model with k12 = 0
(b) The SSCED model with a default value of k12
(c) The SSCED model with k12 matched to the data
(d) The van Laar equation
(e) Plot the P-x-y diagram at 80°C, based on the fits specified by your instructor.
Data from problem 11.11:
Fit the Margules two-parameter equation to the n-pentane(1) + acetone(2) system P-x-y data below at 1 bar (Lo et al. 1962. J. Chem. Eng. Data 7:32) by fitting to x1 = 0.503. Plot the resultant fit together with the original data for both phases.
Compare the data with the predictions of the MAB model.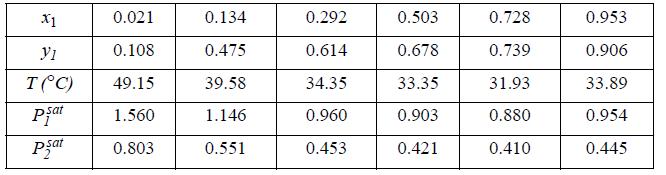
Step by Step Answer:

This question has not been answered yet.
You can Ask your question!

Introductory Chemical Engineering Thermodynamics
ISBN: 9780136068549
2nd Edition
Authors: J. Elliott, Carl Lira
