

Plot P r versus r for the Peng-Robinson equation with T r = [0.7,0.9,1.0], showing both vapor
Question:
Plot Pr versus ρr for the Peng-Robinson equation with Tr = [0.7,0.9,1.0], showing both vapor and liquid roots in the two-phase region. Assume ω = 0.040 as for N2. Include the entire curve for each isotherm, as illustrated in Fig. 7.1. Also show the horizontal line that connects the vapor and liquid densities at the saturation pressure. Use lines without points for the theoretical curves. Estimate Trsat by log(Prsat) = 2.333(1 + ω) (1 - 1/Trsat).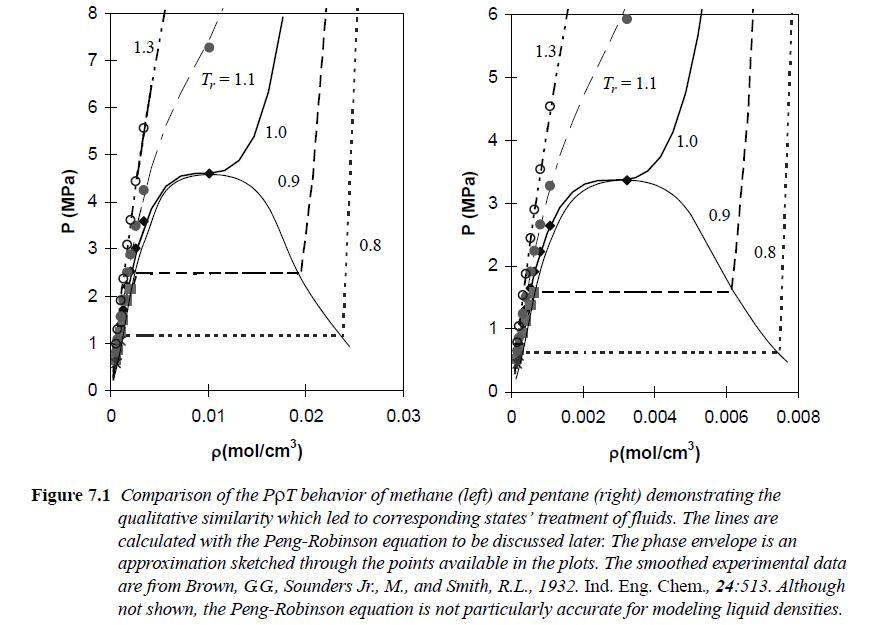
Step by Step Answer:

This question has not been answered yet.
You can Ask your question!
Related Book For 
Introductory Chemical Engineering Thermodynamics
ISBN: 9780136068549
2nd Edition
Authors: J. Elliott, Carl Lira
Question Posted:
