

In a survey of college students, data were gathered on their actual height (height) in inches and
Question:
In a survey of college students, data were gathered on their actual height (height) in inches and the height they would like to be if they could magically be any height (magic height). The results, shown in the following scatterplot, have a correlation of 0.842. The equation of the regression line is magic height = 5.51 + 0.9471(height)
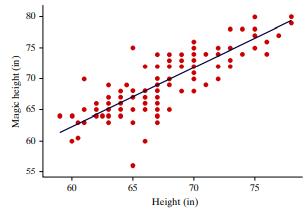
a. What does the slope of the regression equation mean in context?
b. What is the value of R2 , and what does that number mean in context?
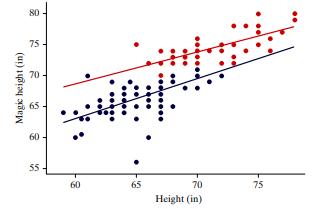
c. In the following scatterplot, the blue dots represent the females in survey and the orange dots represent the males. The regression equations are:
i. Which equation, A or B, represents the females? Explain how you know.
A. magic height = 38.17 + 0.5084(height)
B. magic height = 24.41 + 0.6436(height)
ii. Based on the regression equation, for a male that is 70 inches tall, does he wish he were taller or shorter than 70 inches? Explain.
iii. Based on the regression equation, for a female that is 70 inches tall, does she wish she were taller or shorter than 70 inches? Explain
Step by Step Answer:
a As the height increases by one inch the magical height is predicted to increase by 09471 inch b ...View the full answer


Introduction To Statistical Investigations
ISBN: 9781119683452
2nd Edition
Authors: Beth L.Chance, George W.Cobb, Allan J.Rossman Nathan Tintle, Todd Swanson Soma Roy
