

In 2015, we sampled 13 homes from Zillow that were for sale just north of a small
Question:
In 2015, we sampled 13 homes from Zillow that were for sale just north of a small lake in Michigan and recorded the selling price and the square footage of the home. The results, shown in the following scatterplot, have a correlation of 0.67
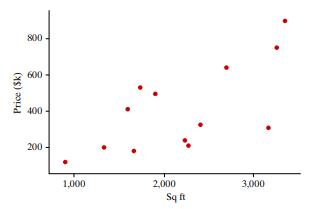
a. Describe the direction, form, and strength of the association between price and square footage of these homes.
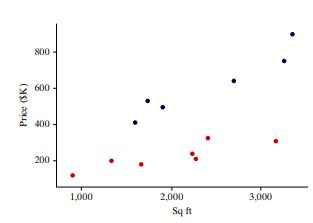
b. Some of the homes in our sample were on the lake, and some were not. In the following scatterplot, the blue dots represent the homes on the lake, and the orange dots represent the homes not on the lake. Remember that the correlation for all the homes together was 0.678. How has this changed for just the homes on the lake? For just the homes off the lake? Explain.
Step by Step Answer:
a The direction is positive the form is ...View the full answer


Introduction To Statistical Investigations
ISBN: 9781119683452
2nd Edition
Authors: Beth L.Chance, George W.Cobb, Allan J.Rossman Nathan Tintle, Todd Swanson Soma Roy
