

In 2015, we sampled 13 homes from Zillow that were for sale just north of a small
Question:
In 2015, we sampled 13 homes from Zillow that were for sale just north of a small lake in Michigan and recorded the selling price and the square footage of the home. The results are shown in the following scatterplot. The equation of the regression line is price = −59,368.10 + 212.74(sq ft), and correlation between price and square footage is 0.678.
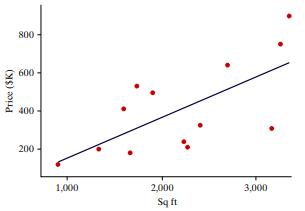
a. What does the slope of the regression equation mean in context?
b. What is the value of R2 , and what does that number mean in context?
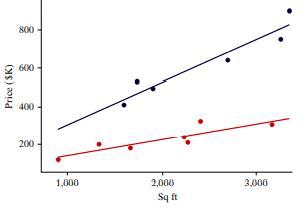
c. Some of the homes in our sample were on the lake and some were not. In the following scatterplot, the blue dots represent the homes on the lake, and the orange dots represent the homes not on the lake.
i. How has the slope changed from when all the homes were included to including just those one the lake? To including just those not on the lake?
ii. How has the value of R2 changed from when all the homes were included to including just those one the lake? To including just those not on the lake?
Step by Step Answer:
a As the square footage increases by one the price is predicted to increase by 21274 b R 2 0678 2 0...View the full answer


Introduction To Statistical Investigations
ISBN: 9781119683452
2nd Edition
Authors: Beth L.Chance, George W.Cobb, Allan J.Rossman Nathan Tintle, Todd Swanson Soma Roy
