

The following table gives the 2015 total payroll (in millions of dollars) and the percentage of games
Question:
The following table gives the 2015 total payroll (in millions of dollars) and the percentage of games won during the 2015 season by each of the National League baseball teams.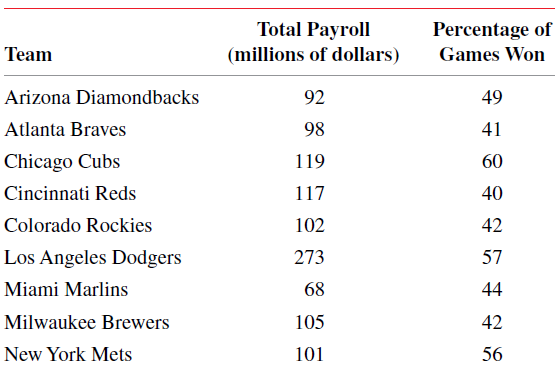
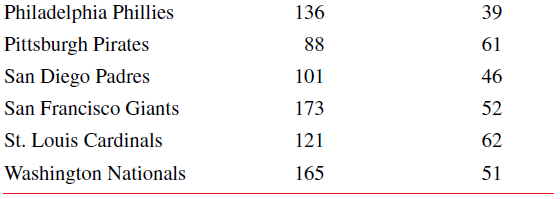
Compute the linear correlation coefficient, ρ. Does it make sense to make a confidence interval and to test a hypothesis about ρ here? Explain.
Fantastic news! We've Found the answer you've been seeking!
Step by Step Answer:
Let x total payroll in millions of dollars and y percentag...View the full answer

Answered By
Utsab mitra
I have the expertise to deliver these subjects to college and higher-level students. The services would involve only solving assignments, homework help, and others.
I have experience in delivering these subjects for the last 6 years on a freelancing basis in different companies around the globe. I am CMA certified and CGMA UK. I have professional experience of 18 years in the industry involved in the manufacturing company and IT implementation experience of over 12 years.
I have delivered this help to students effortlessly, which is essential to give the students a good grade in their studies.
2+ Reviews
10+ Question Solved
Related Book For 

Question Posted:
