

The following figure shows a scatterplot of the educational level of twins. Describe the scatterplot. Explain the
Question:
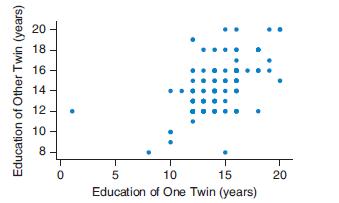
The following figure shows a scatterplot of the educational level of twins. Describe the scatterplot. Explain the trend and mention any unusual points.
Fantastic news! We've Found the answer you've been seeking!
Step by Step Answer:
The scatterplot youve provided visualizes the relationship between the educational level presumably measured in years of education completed of one tw...View the full answer

Answered By
Amos Kiprotich
I am a wild researcher and I guarantee you a well written paper that is plagiarism free. I am a good time manager and hence you are assured that your paper will always be delivered a head of time. My services are cheap and the prices include a series of revisions, free referencing and formatting.
15+ Reviews
21+ Question Solved
Related Book For 

Introductory Statistics Exploring The World Through Data
ISBN: 9780135163146
3rd Edition
Authors: Robert Gould, Rebecca Wong, Colleen N. Ryan
Question Posted:
