

The accompanying table shows data from the World Bank, World Development Indicators, for real GDP per capita
Question:
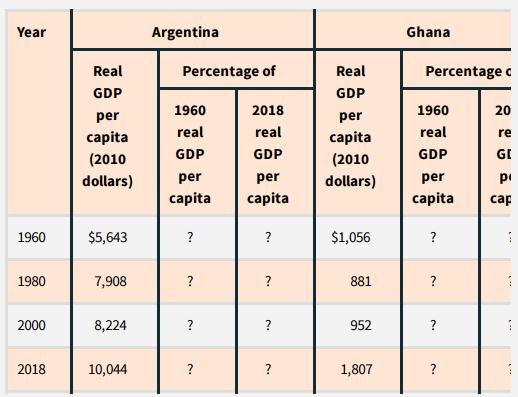
The accompanying table shows data from the World Bank, World Development Indicators, for real GDP per capita in 2010 U.S. dollars for Argentina, Ghana, South Korea, and the United States for 1960, 1980, 2000, and 2018.
a. Complete the table by expressing each yearʼs real GDP per capita as a percentage of its 1960 and 2018 levels.
b. How does the growth in living standards from 1960 to 2018 compare across these four nations? What might account for these differences?
Fantastic news! We've Found the answer you've been seeking!
Step by Step Answer:
a Completing the Table Based on the data in the image heres the completed table with additional columns showing real GDP per capita as a percentage of ...View the full answer

Answered By
Muhammad Umair
I have done job as Embedded System Engineer for just four months but after it i have decided to open my own lab and to work on projects that i can launch my own product in market. I work on different softwares like Proteus, Mikroc to program Embedded Systems. My basic work is on Embedded Systems. I have skills in Autocad, Proteus, C++, C programming and i love to share these skills to other to enhance my knowledge too.
1+ Reviews
10+ Question Solved
Related Book For 

Question Posted:
