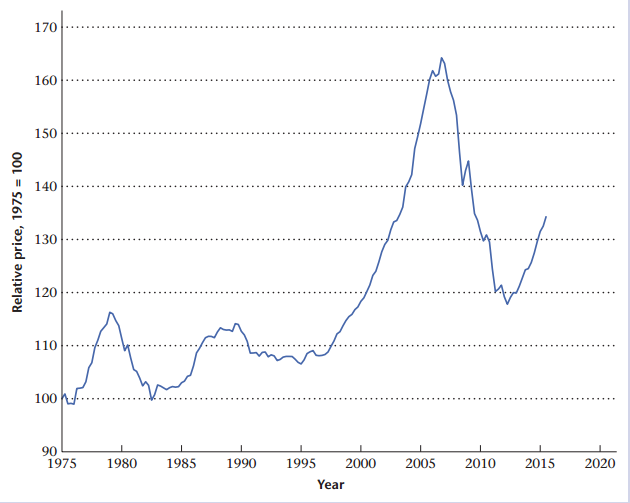
In Figure 1.15, there were two periods prior to 20062012 when the relative price of housing declined.

Question:

In Figure 1.15, there were two periods prior to 2006€“2012 when the relative price of housing declined. Examine some of the other data figures in this chapter and determine what other events these housing price declines coincide with. Compare these events to what was going on during the period 2006€“2012. Discuss.


Figure 1.15:

170 160 150 140 130 120 110 100 90 1975 2000 2005 1980 1985 1990 1995 2010 2015 2020 Year Relative price, 1975 = 100

Fantastic news! We've Found the answer you've been seeking!

Step by Step Answer:

Related Book For  book-img-for-question

Macroeconomics

ISBN: 978-0134472119

6th Edition

Authors: Stephen D. Williamson

Question Posted: