

Question: From the two graphs below, construct two graphs that depict the cost behaviour on a perdriver-unit basis. Which of the two constructed graphs shows fixed
From the two graphs below, construct two graphs that depict the cost behaviour on a perdriver-unit basis. Which of the two constructed graphs shows fixed cost behaviour? Variable cost behaviour?
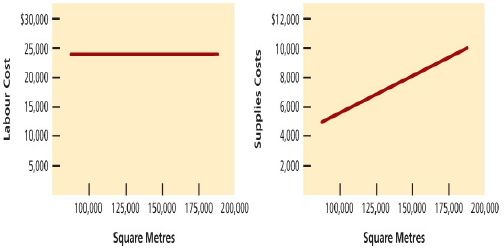
$30,000 $12,000 25,000 10,000 20,000 8,000- 15,000 - 6,000 4.000 10,000- 5,000 2,000 100,000 125,000 150,000 175,000 200,000 100,000 125,000 150,000 175,000 200,000 Square Metres Square Metres Labour Cost Supplies Costs
Step by Step Solution
★★★★★
3.30 Rating (171 Votes )
There are 3 Steps involved in it
1 Expert Approved Answer
Step: 1 Unlock

Square Metre Labour Cost Labour Cost per Square Met... View full answer
Question Has Been Solved by an Expert!
Get step-by-step solutions from verified subject matter experts
Step: 2 Unlock
Step: 3 Unlock