

Question: From the two graphs below, construct two graphs that depict the cost behaviour on a total cost basis. Which of the two constructed graphs shows
From the two graphs below, construct two graphs that depict the cost behaviour on a total cost basis. Which of the two constructed graphs shows fixed cost behaviour? Variable cost behaviour?
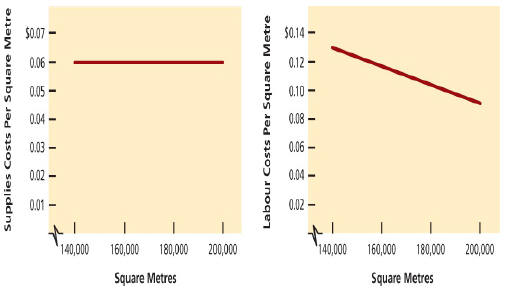
$0.14 - $0.07 - 0.06 - 0.12 0.05 0.10 0.04 0.08 0.06 0.03 0.04 0.02 - Q.02 0.01 ' 140,000 '140,000 200,000 160,000 180,000 160,000 180,000 200,000 Square Metres Square Metres Supplies Costs Per Square Metre Labour Costs Per Square Metre
Step by Step Solution
3.28 Rating (166 Votes )
There are 3 Steps involved in it
Square Metres Labour Cost per Square Metre estimated Total Labour Cost Supplies Cost per Squ... View full answer

Get step-by-step solutions from verified subject matter experts