

Every summer, the touring company America by Bicycle conducts the Cross Country Challenge, a 7-week bicycle journey
Question:
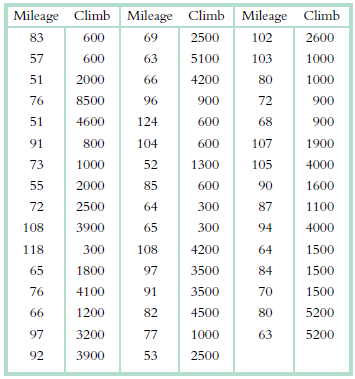
a. Construct a scatterplot of the cycling data, putting mileage on the x-ax is. Be sure to label everything and include a title.
b. We haven€™t yet learned to calculate inferential statistics on these data, so we can€™t estimate what€™s really going on, but do you think that the amount of vertical climb is related to a day€™s mileage? If yes, explain the relation in your own words. If no, explain why you think there is no relation.
c. It turns out that inferential statistics do not support the existence of a relation between these variables and that the staff seems to be the most accurate in their appraisal. Why do you think the cyclists and organizers are wrong in opposite directions? What does this say about p eople€™s biases and the need for data?
Step by Step Answer:
a b For the most part the points on the scatterplot do not seem to indicate any particul...View the full answer


Essentials Of Statistics For The Behavioral Sciences
ISBN: 9781464107771
3rd Edition
Authors: Susan A. Nolan
