

Question: Go to https://blog.hubspot.com/marketing/how-to-build-excel-graph if you are not familiar with using Excel to make charts and graphs and view the video and instructions. Create the following:
Go to https://blog.hubspot.com/marketing/how-to-build-excel-graph if you are not familiar with using Excel to make charts and graphs and view the video and instructions. Create the following:
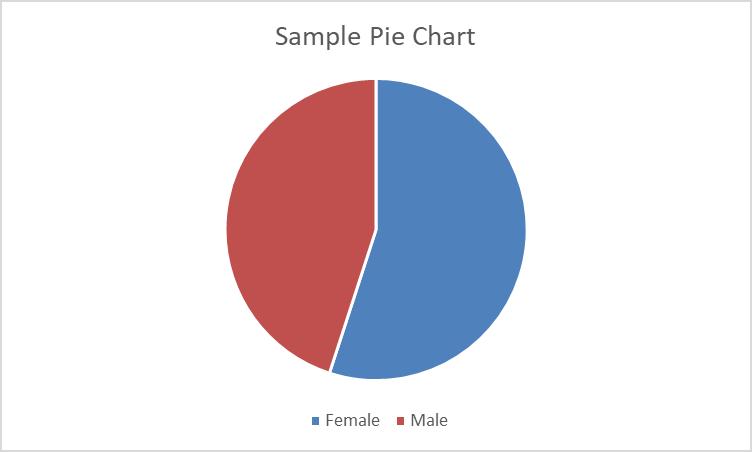
a. Pie chart showing a population is 55% female and 45% male.
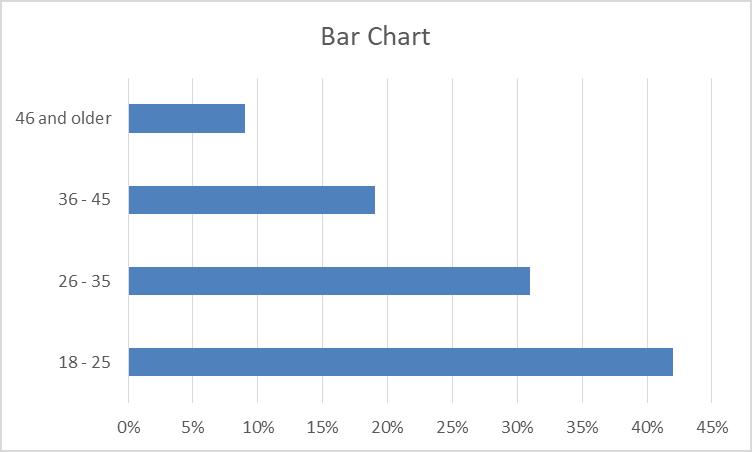
b. Bar chart showing the following unaided awareness figures by age group – 18-25 – 42%, 26-35 - 31%, 36-45 – 19%, 46 and older – 9%. What does this graph show?
Sample Pie Chart Female Male
Step by Step Solution
★★★★★
3.33 Rating (165 Votes )
There are 3 Steps involved in it
1 Expert Approved Answer
Step: 1 Unlock

a b The chart clearly ... View full answer
Question Has Been Solved by an Expert!
Get step-by-step solutions from verified subject matter experts
Step: 2 Unlock
Step: 3 Unlock