

Researchers used the normal curve to investigate cheating among online gamers playing a car racing game (Christensen
Question:
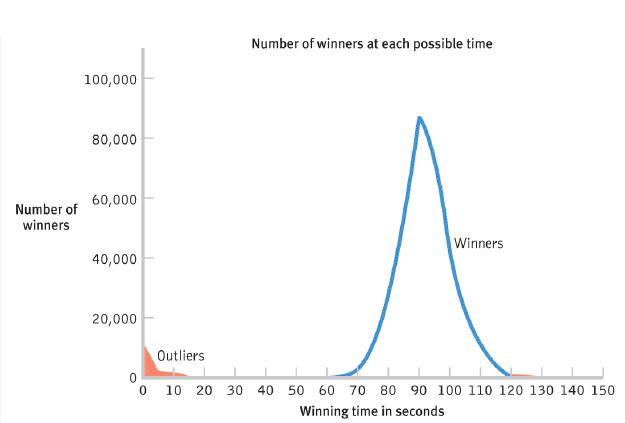
Researchers used the normal curve to investigate cheating among online gamers playing a car racing game (Christensen et al., 2013). The graph shows the winning times for one version of the game.
a. Referring to Chapter 3, what kind of graph is this and why? Imagine that the curve represents the outline of many bars stacked close together.
b. In what ways does this graph resemble a normal curve? In what ways does it deviate from a normal curve? If there is skew, what kind of skew is represented here?
c. The researchers used outliers to identify cheaters. What are outliers?
d. The researchers reported that they used interquartile range (IQR) to identify outliers. What is the interquartile range and how did they likely use it to determine outliers?
e. The researchers analyzed data from almost 140,000 players who together generated approximately 2.2 million scores. If the researchers had recruited these players as participants in the study, what kind of a sample would this have been? Explain your answer.
f. One way that the researchers determined who was cheating was by calculating differences between the winning times logged by players’ computers and the winning times logged by the servers to which their computers connected. Bigger differences were labeled “suspicious” because they indicated that the players may have artificially sped up or slowed down the game on their own computers. How could the normal curve be used to identify cheaters based on this difference measure?
g. The researchers reported other interesting results for race times based on type of game. They found that race times were faster when players competed against each other than when players competed against the computer. What types of variables are race times and type of game? Explain your answer.
Step by Step Answer:
a This graph is a histogram because it displays the distribution of a continuous variable winning times by grouping the data into intervals bins and s...View the full answer


Statistics For The Behavioral Sciences
ISBN: 9781319190743
5th Edition
Authors: Susan A. Nolan, Thomas Heinzen
