

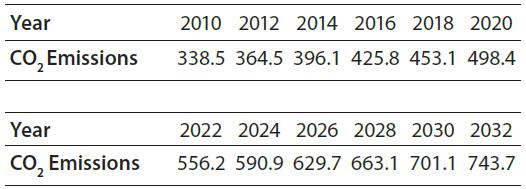
The following table gives the millions of metric tons of carbon dioxide emissions from biomass energy combustion
Question:
The following table gives the millions of metric tons of carbon dioxide emissions from biomass energy combustion in the United States for selected years from 2010 and projected to 2032.
(a) Create a cubic function that models these data, with x as the number of years past 2010 and y as the millions of metric tons of carbon dioxide emissions. Report your model with two significant digit coefficients.
(b) The data show that carbon dioxide emissions are increasing during the period from 2010 to 2032. Use the reported model to find the point at which the rate of increase begins to decrease.
(c) Interpret the result found in part (b).
(d) What feature of the graph corresponds to the point found in part (b)?
Step by Step Answer:
a y 002x 3 086x 2 10x 340 b d c The model predicts ...View the full answer


Mathematical Applications For The Management, Life And Social Sciences
ISBN: 9781337625340
12th Edition
Authors: Ronald J. Harshbarger, James J. Reynolds
