New Semester
Started
Get
50% OFF
Study Help!
--h --m --s
Claim Now
Question Answers
Textbooks
Find textbooks, questions and answers
Oops, something went wrong!
Change your search query and then try again
S
Books
FREE
Study Help
Expert Questions
Accounting
General Management
Mathematics
Finance
Organizational Behaviour
Law
Physics
Operating System
Management Leadership
Sociology
Programming
Marketing
Database
Computer Network
Economics
Textbooks Solutions
Accounting
Managerial Accounting
Management Leadership
Cost Accounting
Statistics
Business Law
Corporate Finance
Finance
Economics
Auditing
Tutors
Online Tutors
Find a Tutor
Hire a Tutor
Become a Tutor
AI Tutor
AI Study Planner
NEW
Sell Books
Search
Search
Sign In
Register
study help
mathematics
basic technical mathematics
Basic Technical Mathematics 12th Edition Allyn J. Washington, Richard Evans - Solutions
Use a calculator to solve the given inequalities. Graph the appropriate function and from the graph determine the solution.x3 + x + 1 < 0
Use a calculator to solve the given inequalities. Graph the appropriate function and from the graph determine the solution. 4 R + 2 Л 6
Draw a sketch of the graph of the region in which the points satisfy the given system of inequalities.|y + 2| < 5|x − 3| ≤ 2
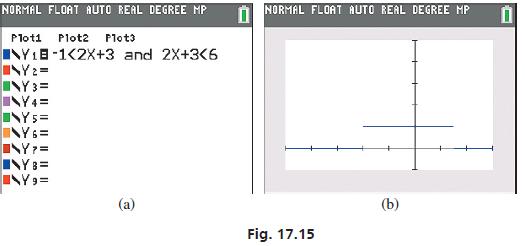
Solve the inequalities by displaying the solutions on a calculator. See Examples 9 and 10.1/3x − 2 ≤ 1/2x + 1Data from Example 10Display the solution of the inequality −1 < 2x + 3 < 6 (see Example 6) on a calculator. In order to display the solution, we must write the inequality as −1
Graph the given inequalities on the number line.x ≤ −1 or x > 0.5
Determine the values for x for which the radicals represent real numbers. √-2x - x²
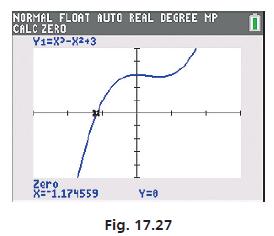
Solve the given quadratic inequalities. Check each by displaying the solution on a calculator.|x2 + 3x − 1| < 3 (See Exercise 31.)Data from Exercises 31|x2 + x − 4| < 2[Use Eq. (17.2), and then treat the resulting inequality as two inequalities of the form f (x) > −n and f (x) <
Solve the inequalities by displaying the solutions on a calculator. See Examples 9 and 10.0.1 < 0.5 − 0.2t < 0.9Data from Example 10Display the solution of the inequality −1 < 2x + 3 < 6 (see Example 6) on a calculator. In order to display the solution, we must write the inequality
Draw a sketch of the graph of the region in which the points satisfy the given system of inequalities.16x + 3y − 12 > 0 y > x² − 2x − 3|2x − 3| < 3
Graph the given inequalities on the number line.x < −300 or x ≥ 0
Determine the values for x for which the radicals represent real numbers. x³ + 6x² + 8x 3-x
Use a calculator to solve the given inequalities. Graph the appropriate function and from the graph determine the solution.e−t > 0.5
Solve for x if |x| < a and a ≤ 0. Explain.
Draw a sketch of the graph of the region in which the points satisfy the given system of inequalities.y > 0, x < 0, y ≤ x
Solve the inequalities by displaying the solutions on a calculator. See Examples 9 and 10.−3 < 2 −s/3 ≤ −1Data from Example 10Display the solution of the inequality −1 < 2x + 3 < 6 (see Example 6) on a calculator. In order to display the solution, we must write the inequality as
Graph the given inequalities on the number line.0 ≤ x < 5
Use a calculator to solve the given inequalities. Graph the appropriate function and from the graph determine the solution.sin 2x < 0.8 (0 < x < 4)
Solve for x if |x − 1| < 4 and x ≥ 0.
Solve the given inequalities graphically by using a calculator. See Example 8. Round all decimals to the nearest hundredth.x3 − x > 2Data from Example 8Use a calculator to solve the inequality x3 > x2 − 3. Finding the equivalent inequality with zero on the right, we have x3 − x2 + 3
Draw a sketch of the graph of the region in which the points satisfy the given system of inequalities.y ≤ 0, x ≥ 0, y ≥ x
Solve the inequalities by displaying the solutions on a calculator. See Examples 9 and 10.x − 3 < 2x + 5 < 6x + 7Data from Example 10Display the solution of the inequality −1 < 2x + 3 < 6 (see Example 6) on a calculator. In order to display the solution, we must write the inequality
Graph the given inequalities on the number line.−4 < y < −2
Draw a sketch of the region in which the points satisfy the given inequality or system of inequalities.y > 12 − 3x
Solve for x: |x − 5| < 3 and |x − 7| < 2.
Solve the inequalities by displaying the solutions on a calculator. See Examples 9 and 10.n − 3 < 2n + 4 ≤ 1 − nData from Example 10Display the solution of the inequality −1 < 2x + 3 < 6 (see Example 6) on a calculator. In order to display the solution, we must write the inequality
Use a calculator to display the solution of the given inequality or system of inequalities.2x + y < 5
Solve the given inequalities graphically by using a calculator. See Example 8. Round all decimals to the nearest hundredth.0.5x3 < 3 − 2x2Data from Example 8Use a calculator to solve the inequality x3 > x2 − 3. Finding the equivalent inequality with zero on the right, we have x3 − x2 +
Graph the given inequalities on the number line.x ≥ −3 and x < 5
Draw a sketch of the region in which the points satisfy the given inequality or system of inequalities.y < 1/2x + 2
Solve the inequalities by displaying the solutions on a calculator. See Examples 9 and 10.−2(2.5x) + 5 ≥ 3Data from Example 10Display the solution of the inequality −1 < 2x + 3 < 6 (see Example 6) on a calculator. In order to display the solution, we must write the inequality as −1
Solve for x: 1 < |x − 2| < 3.
Solve the given inequalities graphically by using a calculator. See Example 8. Round all decimals to the nearest hundredth.x4 < x2 − 2x − 1Data from Example 8Use a calculator to solve the inequality x3 > x2 − 3. Finding the equivalent inequality with zero on the right, we have x3 − x2
Use a calculator to display the solution of the given inequality or system of inequalities.4x − 2y > 1
Graph the given inequalities on the number line.x > 4 and x < 3
Solve the inequalities by displaying the solutions on a calculator. See Examples 9 and 10.ln(x − 3) ≥ 1Data from Example 10Display the solution of the inequality −1 < 2x + 3 < 6 (see Example 6) on a calculator. In order to display the solution, we must write the inequality as −1 <
Draw a sketch of the region in which the points satisfy the given inequality or system of inequalities.4y − 6x − 8 ≤ 0
If |x − 1| < 4, find a and b if a < x + 4 < b.
Solve the given inequalities graphically by using a calculator. See Example 8. Round all decimals to the nearest hundredth.3x4 + x + 1 > 5x2Data from Example 8Use a calculator to solve the inequality x3 > x2 − 3. Finding the equivalent inequality with zero on the right, we have x3 − x2 +
Use a calculator to display the solution of the given inequality or system of inequalities.y ≥ 1 − x2
Graph the given inequalities on the number line.x < −1 or 1 ≤ x < 4
Draw a sketch of the region in which the points satisfy the given inequality or system of inequalities.3y − x + 6 ≥ 0
Solve for x if |x − 1| > 4 and |x − 3| < 5.
Solve the given inequalities graphically by using a calculator. See Example 8. Round all decimals to the nearest hundredth.2x > x + 2Data from Example 8Use a calculator to solve the inequality x3 > x2 − 3. Finding the equivalent inequality with zero on the right, we have x3 − x2 + 3 >
Draw a sketch of the region in which the points satisfy the given inequality or system of inequalities. y≤ 6 x² - 49
Use a calculator to display the solution of the given inequality or system of inequalities.y < |4 − 2x|
Solve the given inequalities graphically by using a calculator. See Example 8. Round all decimals to the nearest hundredth.log x < 1 − 2x2Data from Example 8Use a calculator to solve the inequality x3 > x2 − 3. Finding the equivalent inequality with zero on the right, we have x3 − x2 +
Graph each solution. Determine the values of x that are in the domain of the function f(x)=√2x 10. -
Graph the given inequalities on the number line.−3 < x < 0 or x > 3
Draw a sketch of the region in which the points satisfy the given inequality or system of inequalities.2x > 6 − y
Graph each solution. Determine the values of x that are in the domain of the function f(x)=1/√30.5.x.
The thickness t (in km) of Earth’s crust varies and can be described as |t − 27| ≤ 23. What are the minimum and maximum values of the thickness of Earth’s crust?
Use a calculator to display the solution of the given inequality or system of inequalities.y > 2x − 1y < x4 − 8
Solve the given inequalities graphically by using a calculator. See Example 8. Round all decimals to the nearest hundredth.sin x < 0.1x2 − 1Data from Example 8Use a calculator to solve the inequality x3 > x2 − 3. Finding the equivalent inequality with zero on the right, we have x3 − x2
Solve the given inequalities graphically by using a calculator. See Example 8. Round all decimals to the nearest hundredth.sin x < 0.1x2 − 1Data from Example 8Use a calculator to solve the inequality x3 > x2 − 3. Finding the equivalent inequality with zero on the right, we have x3 − x2
Graph the given inequalities on the number line.−3 < x < −1 or 0.5 < x ≤ 3
A motorist notes the gasoline gauge and estimates there are about 9 gal in the tank, but knows the estimate may be off by as much as 1 gal. This means we can write |n − 9| ≤ 1, where n is the number of gallons in the tank. Using this inequality, what distance can the car go on this gas, if it
Use a calculator to display the solution of the given inequality or system of inequalities.y < 3 − xy > 3x − x3
Graph the given inequalities on the number line.x ≤ 4 or x > −4
Draw a sketch of the region in which the points satisfy the given inequality or system of inequalities.y − |x + 1| < 0
The production p (in barrels) of oil at a refinery is estimated at 2,000,000 ± 200,000. Express p using an inequality with absolute values and describe the production in a verbal statement.
Solve the given inequalities graphically by using a calculator. See Example 8. Round all decimals to the nearest hundredth.4 cos2x > 2x − 3Data from Example 8Use a calculator to solve the inequality x3 > x2 − 3. Finding the equivalent inequality with zero on the right, we have x3 − x2 +
Use a calculator to display the solution of the given inequality or system of inequalities.y > x² + 2x − 8y < 1/x − 2
For what values of k are the roots of the equation x2 − kx + 9 = 0 imaginary?
Graph the given inequalities on the number line.t ≤ −5 and t ≥ −5
Draw a sketch of the region in which the points satisfy the given inequality or system of inequalities.2y + 2x3 + 6x > 3
According to the Waze navigation app, the time required for a driver to reach his destination is 52 min. If this time is accurate to ±3 min, express the travel time t using an inequality with absolute values.
Use a calculator to display the solution of the given inequality or system of inequalities.2y > −4x2y <1 −e−x
Graph the given inequalities on the number line.x < 1 or 1 < x ≤ 4
Draw a sketch of the region in which the points satisfy the given inequality or system of inequalities.y > x + 1y < 4 − x2
The temperature T (in °C) at which a certain machine can operate properly is 70 ± 20. Express the temperature T for proper operation using an inequality with absolute values.
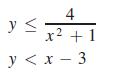
Draw a sketch of the region in which the points satisfy the given inequality or system of inequalities. y ≤ y < 4 x² + 1 x-3
Use inequalities to solve the given problems.Is x2 > x for all x? Explain.
Use a calculator to display the solution of the given inequality or system of inequalities.y ≤ |2x − 3|y >1 − 2x²
Solve the given problems by setting up and solving appropriate inequalities. Graph each solution.For −6 < x < 2, find a and b if a < 5 − x < b.
Graph the given inequalities on the number line.(x ≤ 5 or x ≥ 8) and (3 < x < 10)
Draw a sketch of the region in which the points satisfy the given inequality or system of inequalities.y > 2x − x2y ≥ −2
The Mach number M of a moving object is the ratio of its velocity v to the velocity of sound vs, and vs varies with temperature. A jet traveling at 1650 km/h changes its altitude from 500 m to 5500 m. At 500 m (with the temperature at 27° C), vs = 1250 km/h, and at 5500 m (−3°C), vs = 1180 km
Use inequalities to solve the given problems.Is x > 1/x for all x? Explain.
Use a calculator to display the solution of the given inequality or system of inequalities.y ≥ |4 − x²|y < 2 In|x|
Solve the given problems by setting up and solving appropriate inequalities. Graph each solution.For 8 > −x > −4, find a and b such that a < x + 1 < b.
Graph the given inequalities on the number line.(x < 7 and x > 2) or (x ≥ 10 or x < 1)
The diameter d of a certain type of tubing is 3.675 cm with a tolerance of 0.002 cm. Express this as an inequality with absolute values.
Find an inequality of the form ax2 + bx + c < 0 with a > 0 for which the solution is −1 < x < 4.
By an inequality, define the region below the line 9x − 3y + 12 = 0.
Answer the given questions about the inequality 0 < a < b.Is a2 < b2 a conditional inequality or an absolute inequality?
The velocity v (in ft/s) of a projectile launched upward from the ground is given by v = −32t + 56, where t is given in seconds. Given that speed = |velocity|, find the times at which the speed is greater than 8 ft/s.
Draw a sketch of the region in which the points satisfy the given inequality or system of inequalities.y < cos 1/2x y > 1/2ex –π < x < π
Find an inequality of the form ax3 + bx < 0 with a > 0 for which the solution is x < −1 or 0 < x < 1.
By an inequality, define the region that is bounded by or includes the parabola x2 − 2y = 0, and that contains the point (1, 0.4).
Answer the given questions about the inequality 0 < a < b.Is |a − b| < b − a?
The voltage v in a certain circuit is given by v = 6.0 − 200i, where i is the current (in A). For what values of the current is the absolute value of the voltage less than 2.0 V?
Algebraically find the values of x for which 2x+2 > 32x−3.
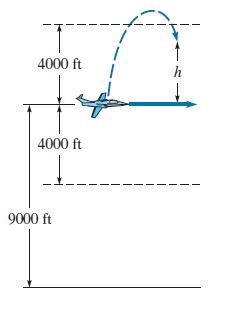
A rocket is fired from a plane flying horizontally at 9000 ft. The height h (in ft) of the rocket above the plane is given by h = 560t − 16t2, where t is the time (in s) of flight of the rocket. When is the rocket more than 4000 ft above or below the plane? See Fig. 17.36.Fig. 17.36. T 4000
Use a calculator to display the region in which the points satisfy the given inequality or system of inequalities.y < 3x + 5
For Ax + By < C, if B < 0, would you shade above or below the line?
What range of annual interest I will give between $120 and $150 annual income from an investment of $7500?
Answer the given questions about the inequality 0 < a < b.If each member of the inequality 2 > 1 is multiplied by a − b, is the result 2(a − b) > (a − b)?
Use a calculator to display the region in which the points satisfy the given inequality or system of inequalities.x > 8 − 4y
Graphically find the values of x for which 2 log2 x < log3 (x + 1).
Find a system of inequalities that would describe the region within the triangle with vertices (0, 0), (0, 4), and (2, 0).
Showing 3500 - 3600
of 9193
First
29
30
31
32
33
34
35
36
37
38
39
40
41
42
43
Last
Step by Step Answers