New Semester
Started
Get
50% OFF
Study Help!
--h --m --s
Claim Now
Question Answers
Textbooks
Find textbooks, questions and answers
Oops, something went wrong!
Change your search query and then try again
S
Books
FREE
Study Help
Expert Questions
Accounting
General Management
Mathematics
Finance
Organizational Behaviour
Law
Physics
Operating System
Management Leadership
Sociology
Programming
Marketing
Database
Computer Network
Economics
Textbooks Solutions
Accounting
Managerial Accounting
Management Leadership
Cost Accounting
Statistics
Business Law
Corporate Finance
Finance
Economics
Auditing
Tutors
Online Tutors
Find a Tutor
Hire a Tutor
Become a Tutor
AI Tutor
AI Study Planner
NEW
Sell Books
Search
Search
Sign In
Register
study help
mathematics
college algebra graphs and models
College Algebra With Modeling And Visualization 6th Edition Gary Rockswold - Solutions
In Exercises 1–23, solve each equation or inequality. Other than Φ, use interval notation to express solution sets of inequalities and graph these solution sets on a number line. 1 VI +
In Exercises 15–35, solve each equation. Then state whether the equation is an identity, a conditional equation, or an inconsistent equation. 2x - 4(5x + 1) = 3x + 17
In Exercises 1–23, solve each equation or inequality. Other than Φ, use interval notation to express solution sets of inequalities and graph these solution sets on a number line. 1 x² 4 = + 1 = 0 X
In Exercises 15–35, solve each equation. Then state whether the equation is an identity, a conditional equation, or an inconsistent equation. 7(x-4)= x + 2
In Exercises 1–23, solve each equation or inequality. Other than Φ, use interval notation to express solution sets of inequalities and graph these solution sets on a number line. 3(x + 4) ≥ 5x – 12
In Exercises 1–23, solve each equation or inequality. Other than Φ, use interval notation to express solution sets of inequalities and graph these solution sets on a number line. 2x x² + 6x + 8 2 x + 2 X x + 4
In Exercises 15–35, solve each equation. Then state whether the equation is an identity, a conditional equation, or an inconsistent equation. 2(x4) + 3(x + 5) = 2x - 2
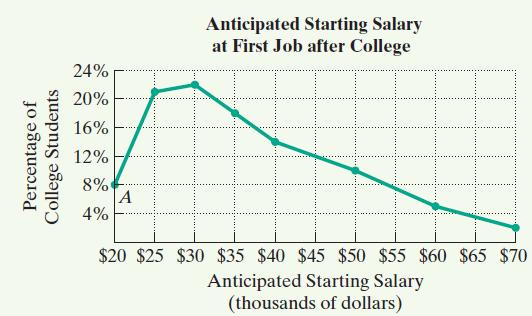
In 2010, Monster College surveyed 1250 U.S. college students expecting to graduate in the next several years. Respondents were asked the following question:What do you think your starting salary will be at your first job after college?The line graph shows the percentage of college students who
In Exercises 1–23, solve each equation or inequality. Other than Φ, use interval notation to express solution sets of inequalities and graph these solution sets on a number line. ند -X - 6 = ن
In Exercises 15–35, solve each equation. Then state whether the equation is an identity, a conditional equation, or an inconsistent equation. 2x − 5 = 7
In Exercises 15–35, solve each equation. Then state whether the equation is an identity, a conditional equation, or an inconsistent equation. 5x + 20 = 3x
In Exercises 1–23, solve each equation or inequality. Other than Φ, use interval notation to express solution sets of inequalities and graph these solution sets on a number line. -3|4x7 + 15 = 0 7기
In Exercises 1–23, solve each equation or inequality. Other than Φ, use interval notation to express solution sets of inequalities and graph these solution sets on a number line. MIN 5x² 10 = 0
In Exercises 1–23, solve each equation or inequality. Other than Φ, use interval notation to express solution sets of inequalities and graph these solution sets on a number line. ³-9x² + 8 = 0
In 2010, Monster College surveyed 1250 U.S. college students expecting to graduate in the next several years. Respondents were asked the following question:What do you think your starting salary will be at your first job after college?The line graph shows the percentage of college students who
In Exercises 1–23, solve each equation or inequality. Other than Φ, use interval notation to express solution sets of inequalities and graph these solution sets on a number line. √x + 4 + √x – 1= 5
In Exercises 1–23, solve each equation or inequality. Other than Φ, use interval notation to express solution sets of inequalities and graph these solution sets on a number line. V8 - 2x - x = 0
In Exercises 1–23, solve each equation or inequality. Other than Φ, use interval notation to express solution sets of inequalities and graph these solution sets on a number line. Vx3 + 5 = x
In 2010, Monster College surveyed 1250 U.S. college students expecting to graduate in the next several years. Respondents were asked the following question:What do you think your starting salary will be at your first job after college?The line graph shows the percentage of college students who
In Exercises 1–23, solve each equation or inequality. Other than Φ, use interval notation to express solution sets of inequalities and graph these solution sets on a number line. 4x² || = 8x - 5
In 2010, Monster College surveyed 1250 U.S. college students expecting to graduate in the next several years. Respondents were asked the following question:What do you think your starting salary will be at your first job after college?The line graph shows the percentage of college students who
In 2010, Monster College surveyed 1250 U.S. college students expecting to graduate in the next several years. Respondents were asked the following question:What do you think your starting salary will be at your first job after college?The line graph shows the percentage of college students who
In Exercises 1–23, solve each equation or inequality. Other than Φ, use interval notation to express solution sets of inequalities and graph these solution sets on a number line. x³ 4x²-x + 4 = 0 +3
In Exercises 1–23, solve each equation or inequality. Other than Φ, use interval notation to express solution sets of inequalities and graph these solution sets on a number line. x(x − 2) = 4
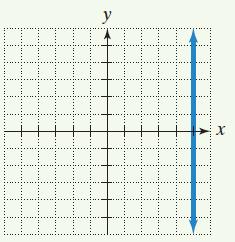
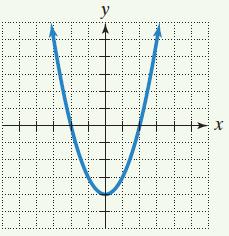
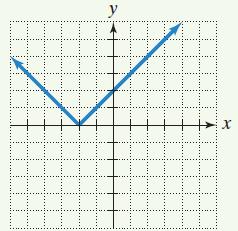
In Exercises 6–8, use the graph and determine the x-intercepts if any, and the y-intercepts if any. For each graph, tick marks along the axes represent one unit each. y HP # X
In 2010, Monster College surveyed 1250 U.S. college students expecting to graduate in the next several years. Respondents were asked the following question:What do you think your starting salary will be at your first job after college?The line graph shows the percentage of college students who
In Exercises 6–8, use the graph and determine the x-intercepts if any, and the y-intercepts if any. For each graph, tick marks along the axes represent one unit each. K LL. y 100 CCCCCCCCCC X
In Exercises 1–23, solve each equation or inequality. Other than Φ, use interval notation to express solution sets of inequalities and graph these solution sets on a number line. (x + 3)² + 25 = 0
In Exercises 6–8, use the graph and determine the x-intercepts if any, and the y-intercepts if any. For each graph, tick marks along the axes represent one unit each. X ...... **** H y B 1:2
In Exercises 1–23, solve each equation or inequality. Other than Φ, use interval notation to express solution sets of inequalities and graph these solution sets on a number line. (3x − 1)² = 75
Graph each equation in Exercises 1–4. Let x = -3, -2, -1, 0,1, 2, and 3. y = x
In Exercises 1–23, solve each equation or inequality. Other than Φ, use interval notation to express solution sets of inequalities and graph these solution sets on a number line. 2x² 3x - 2 = 0
Graph each equation in Exercises 1–4. Let x = -3, -2, -1, 0,1, 2, and 3. 2 y = x² - 3
Graph each equation in Exercises 1–4. Let x = -3, -2, -1, 0,1, 2, and 3. y = |x| x-2
In Exercises 1–23, solve each equation or inequality. Other than Φ, use interval notation to express solution sets of inequalities and graph these solution sets on a number line. 2 x - 3 4 x + 3 || 8 x² - 9
Fill in each blank so that the resulting statement is true.The y-coordinate of a point where a graph crosses the y-axis is called a/an________ . The x-coordinate of such a point is always________ .
In Exercises 1–23, solve each equation or inequality. Other than Φ, use interval notation to express solution sets of inequalities and graph these solution sets on a number line. 7(x - 2) = 4(x + 1) − 21 -
In Exercises 1–23, solve each equation or inequality. Other than Φ, use interval notation to express solution sets of inequalities and graph these solution sets on a number line. −10 − 3(2x + 1) - 8x − 1 = 0
Graph each equation in Exercises 1–4. Let x = -3, -2, -1, 0,1, 2, and 3. y = 2х - 2
What does a [-20, 40, 10] by [-5, 5, 1] viewing rectangle mean? Draw axes with tick marks and label the tick marks to illustrate this viewing rectangle.
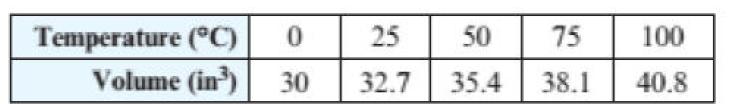
The table shows the relationship between the temperature of a sample of helium and its volume.(a) Make a scatterplot of the data. (b) Write a formula for a function f that receives the temperature x as input and outputs the vol- ume y of the helium. (c) Find the volume when the temperature is
Find a point-slope form of the line satisfy- ing the conditions. Use the first point given for (x1, y1). Then convert the equation to slope-intercept form, and write the formula for a function f whose graph is the line. Slope 1.7, passing through (-8, 10)
Find a point-slope form of the line satisfy- ing the conditions. Use the first point given for (x1, y1). Then convert the equation to slope-intercept form, and write the formula for a function f whose graph is the line. Slope -2.4, passing through (4, 5)
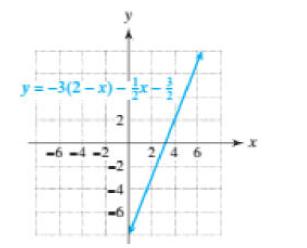
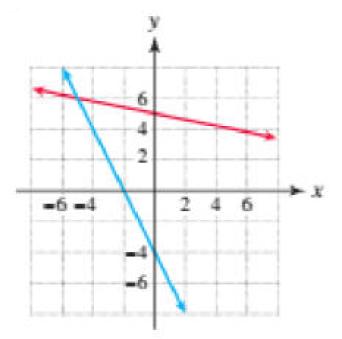
Use the graph to solve each equation and inequality. Then solve each part symbolically. Use set-builder or interval notation when possible. y=-3(2-x)-x- -6-4-2 2 -2 6 mjes 2/4 6
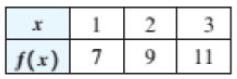
Find the formula for a linear function f that models the data in the table exactly. f(x) 1 2 7 9 3 11
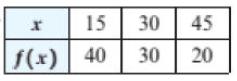
Find the formula for a linear function f that models the data in the table exactly. x 15 f(x) 40 30 30 45 20
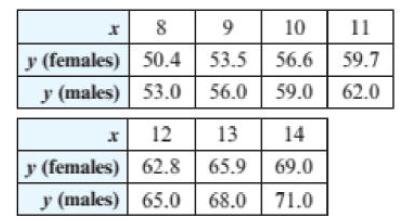
It is possible for archeologists to estimate the height of an adult based only on the length of the humerus, a bone located between the elbow and the shoulder. The approximate relationship between the height y of an individual and the length x of the humerus is shown in the table for both males and
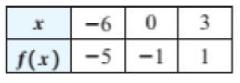
Find the formula for a linear function f that models the data in the table exactly. x -6 0 -5-1 f(x) -5 3 1
Find the point-slope form of the line passing through the given points. Use the first point as (x1, y1). Plot the points and graph the line by hand. (-1,2), (-2,-3)
Solve the linear equation 4(x - 2) = 2(5-x) - 3 by using each method. Compare your results. (a) Graphical (b) Numerical (c) Symbolic
Find the point-slope form of the line passing through the given points. Use the first point as (x1, y1). Plot the points and graph the line by hand. (-3,-1), (1, 2)
Find the point-slope form of the line passing through the given points. Use the first point as (x1, y1). Plot the points and graph the line by hand. (-2,3), (1,0)
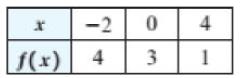
Find the formula for a linear function f that models the data in the table exactly. f(x) 0 4 3 -2 4 1
Solve 5x + 2 = 2x - 3 and check your answer.
Three people leave for a city 15 miles away. The first person walks 4 miles per hour, and the other two people ride in a car that travels 28 miles per hour. After some time, the second person gets out of the car and walks 4 miles per hour to the city while the driver goes back and picks up the
Distinguish between a contradiction and an identity.
Write a symbolic representation (formula) for a function f that calculates the following.(a) The distance traveled by a car moving at 50 miles per hour for x hours (b) The total number of hours in day x (c) The distance in miles between a runner and home after x hours if the runner starts
The death rate from heart disease for people ages 15 through 24 is 2.7 per 100,000 people. (a) Write a function f that models the number of deaths in a population of x million people 15 to 24 years old. (b) There are about 39 million people in the United States who are 15 to 24 years old.
If f(x) = ax + b with a ≠ 0, how are the zero off and the x-coordinate of the x-intercept of the graph of f related?
Find the point-slope form of the line passing through the given points. Use the first point as (x1, y1). Plot the points and graph the line by hand. (1,2), (3,-2)
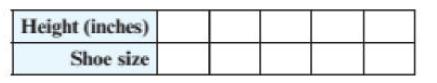
In this exercise you will deter- mine if there is a relationship between height and shoe size. (a) Have classmates write their shoe size and height in inches on a slip of paper. When you have enough information, complete the following table-one for adult males and one for adult females.(b) Make a
What property is used to solve 15x = 5?
Find the x- and y-intercepts of the graph of the equation -3x + 2y = -18.
A driver of a car is initially 50 miles south of home, driving 60 miles per hour south. Write a function f that models the distance between the driver and home.
Repeat the previous exercise for an equilateral triangle. Try to make a generalization.What will happen to the circumference of a circle if the radius is doubled? What will happen to its area? The area of an equilateral triangle is 1 = x², where x is the length of a side.
Write a symbolic representation (formula) for a function f that calculates the following.(a) The number of pounds in x ounces (b) The number of dimes in x dollars (c) The monthly electric bill in dollars if x kilowatt-hours are used at 6 cents per kilowatt-hour and there is a fee of
Apply the distributive property to 4 - (5 - 4x).
The geometric mean of two numbers a and b is given by √ab. Use properties of inequalities to show that if 0 < a < b, then < √ab < b.
Solve the compound inequality -2 ≤ 1-2x ≤ 3. Use set-builder or interval notation.
Biologists sometimes use direct variation to estimate the number of fish in small lakes. They start by tagging a small number of fish and then releasing them. They assume that over a period of time, the tagged fish distribute themselves evenly throughout the lake. Later, they collect a second
How many times does the graph of y = ax + b with a ≠ 0 intersect the x-axis?
Find equations of horizontal and vertical lines that pass through the point (-4, 7).
How many solutions are there to ax + b = 0 with a ≠ 0?
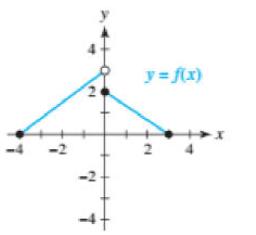
Use the graph of y = f(x) to write a formula for f. Write each piece in slope-piecewise-defined intercept form. y = f(x)
Use the graph of y = f(x) to solve each equation. (a) f(x) = -1 (b) f(x) = 0 (c) f(x) = 2
Use the graph of y = ax + b at the top of the next column to solve each equation and inequality. Write the solution set to each inequality in set-builder or interval notation. (a) ax + b = 0 (b) ax + b
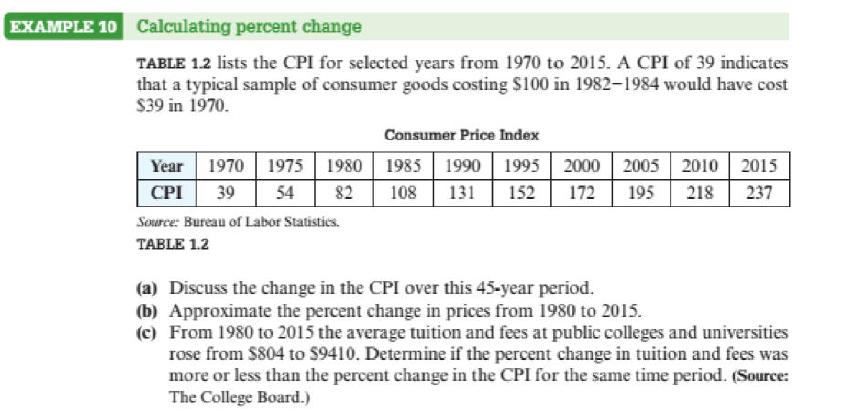
For the following time periods, calculate the percent change in the CPI to the nearest tenth.From 1995 to 2015 EXAMPLE 10 Calculating percent change TABLE 1.2 lists the CPI for selected years from 1970 to 2015. A CPI of 39 indicates that a typical sample of consumer goods costing $100 in 1982-1984
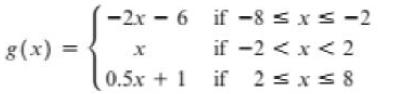
Use g(x) to complete the following.(a) Evaluate g at x = -8, -2, 2, and 8. (b) For what x-values is g increasing? (c) Sketch a graph of g. Is g continuous on its domain? g(x) = -2x6 if-8 ≤ x ≤ -2 if -2 < x < 2 | 0.5x+1 if 2 ≤x≤8
For the following time periods, calculate the percent change in the CPI to the nearest tenth.From 1970 to 2000 EXAMPLE 10 Calculating percent change TABLE 1.2 lists the CPI for selected years from 1970 to 2015. A CPI of 39 indicates that a typical sample of consumer goods costing $100 in 1982-1984
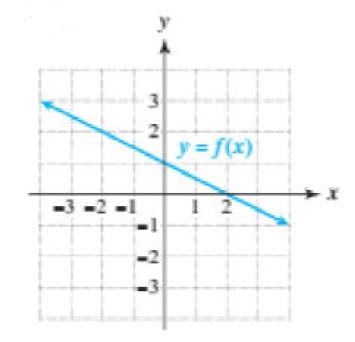
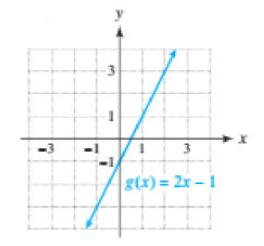
Use the graph to complete the following. (a) Estimate the domain and range of g. Use interval notation. (b) Use the formula to evaluate g(-1) and g(2). (c) Use the graph of g to evaluate g(-1) and g(2). -3 1 3 g(x)=2x-1
For the following time periods, calculate the percent change in the CPI to the nearest tenth.From 2010 to 2015 EXAMPLE 10 Calculating percent change TABLE 1.2 lists the CPI for selected years from 1970 to 2015. A CPI of 39 indicates that a typical sample of consumer goods costing $100 in 1982-1984
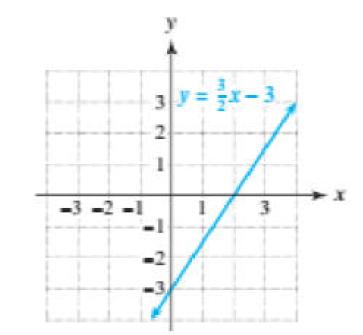
Graph the linear function by hand. Identify the slope and y-intercept. g(x) = -2
For the following time periods, calculate the percent change in the CPI to the nearest tenth.From 1985 to 2005 EXAMPLE 10 Calculating percent change TABLE 1.2 lists the CPI for selected years from 1970 to 2015. A CPI of 39 indicates that a typical sample of consumer goods costing $100 in 1982-1984
Find an equation of the line passing through the points (-3, 4) and (5, -2). Give equations of lines that are parallel and perpendicular to this line.
Find an equation of the line satisfying the conditions. If possible, for each line write a formula for a linear function whose graph is the line. Perpendicular to x = 15, passing through (1.6, -9.5)
The arithmetic mean of two numbers a and b is given by a + b /2. Use properties of inequalities to show that if a < b, then a < (a + b)/2 < b.
Solve the inequality 2(x - 4) > 1 - x. Express the solution set in set-builder notation.
Biologists sometimes use direct variation to estimate the number of fish in small lakes. They start by tagging a small number of fish and then releasing them. They assume that over a period of time, the tagged fish distribute themselves evenly throughout the lake. Later, they collect a second
Find an equation of the line satisfying the conditions. If possible, for each line write a formula for a linear function whose graph is the line. Perpendicular to y = 15, passing through (4, -9)
Suppose that two rectangles are similar and the sides of the first rectangle are twice as long as the corresponding sides of the second rectangle. (a) Is the perimeter of the first rectangle twice the perimeter of the second rectangle? Explain. (b) Is the area of the first rectangle twice
Use the graph of y = ax + b at the top of the next column to solve each equation and inequality. Write the solution set to each inequality in set-builder or interval notation. (a) ax + b = 0 (b) ax + b
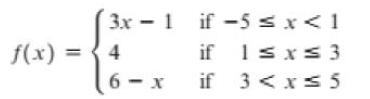
Use f(x) to complete the following.(a) Evaluate f at x = -3, 1, 2, and 5. (b) On what interval is f constant? (c) Sketch a graph off. Is f continuous on its domain? f(x) = 3x1 4 6-x if -5 ≤ x < 1 if 1 ≤x≤3 if 3 < x≤5
Use the graph of y = ax + b at the top of the next column to solve each equation and inequality. Write the solution set to each inequality in set-builder or interval notation. (a) ax + b = 0 (b) ax + b
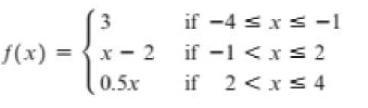
Complete the following for f(x). (a) Determine the domain of f. Use interval notation. (b) Evaluate f(-2), f(0), and f(3). (c) Graph f. (d) Is f continuous on its domain? f(x) = 3 x-2 0.5.x if -4 ≤ x ≤ -1 if -1 < x≤2 if 2 < x≤ 4
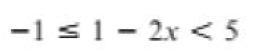
Solve the inequality graphically. Write the solution set in interval notation. -1 −1 ≤ 1 − 2x < 5
Find an equation of the line satisfying the conditions. If possible, for each line write a formula for a linear function whose graph is the line. Horizontal, passing through (1.95, 10.7)
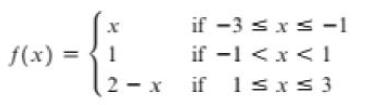
Complete the following for f(x). (a) Determine the domain of f. Use interval notation. (b) Evaluate f(-2), f(0), and f(3). (c) Graph f. (d) Is f continuous on its domain? f(x) = 1 2-x if -3 ≤ x ≤-1 if -1 < x < 1 if 1≤x≤3
Solve the inequality graphically. Write the solution set in interval notation. −3 < x − 2 ≤ 2
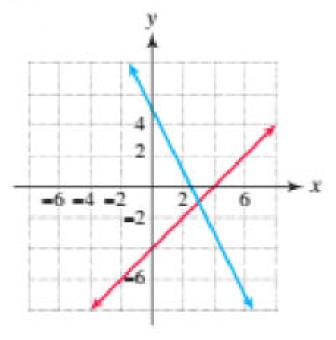
A linear equation is solved by using the intersection-of-graphs method. Find the solution by interpreting the graph. Assume that the solution is an integer. -6-4 2 X
A linear equation is solved by using the intersection-of-graphs method. Find the solution by interpreting the graph. Assume that the solution is an integer. 246
Showing 11600 - 11700
of 13634
First
110
111
112
113
114
115
116
117
118
119
120
121
122
123
124
Last
Step by Step Answers