New Semester
Started
Get
50% OFF
Study Help!
--h --m --s
Claim Now
Question Answers
Textbooks
Find textbooks, questions and answers
Oops, something went wrong!
Change your search query and then try again
S
Books
FREE
Study Help
Expert Questions
Accounting
General Management
Mathematics
Finance
Organizational Behaviour
Law
Physics
Operating System
Management Leadership
Sociology
Programming
Marketing
Database
Computer Network
Economics
Textbooks Solutions
Accounting
Managerial Accounting
Management Leadership
Cost Accounting
Statistics
Business Law
Corporate Finance
Finance
Economics
Auditing
Tutors
Online Tutors
Find a Tutor
Hire a Tutor
Become a Tutor
AI Tutor
AI Study Planner
NEW
Sell Books
Search
Search
Sign In
Register
study help
mathematics
college algebra graphs and models
College Algebra With Modeling And Visualization 6th Edition Gary Rockswold - Solutions
Solve the equation (to the nearest tenth) (a) Symbolically, (b) Graphically, and (c) Numerically. 3(π - x) + √₂ = 0
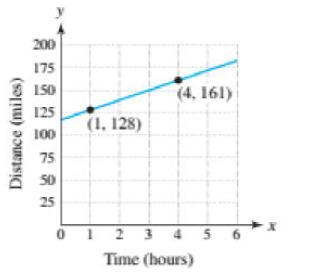
A person is riding a bicycle. The graph shows the rider's distance y in miles from an inter- state highway after x hours.(a) How fast is the bicyclist traveling? (b) Find the slope-intercept form of the line. (c) How far was the bicyclist from the interstate highway initially? (d) How far was
Solve the inequality. Approximate the endpoints to the nearest thousandth when appropriate. 5.1x2√3 - 1.7x -
Solve the equation (to the nearest tenth) (a) Symbolically, (b) Graphically, and (c) Numerically. √3(2- #x) + x = 0
Solve the equation (to the nearest tenth) (a) Symbolically, (b) Graphically, and (c) Numerically. 5- 8x = 3(x-7) + 37
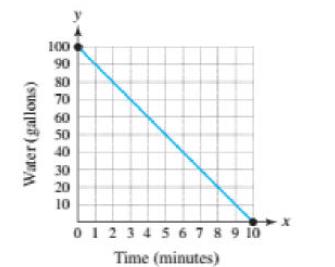
The graph shows the amount of water in a 100-gallon tank after x minutes have elapsed.(a) Is water entering or leaving the tank? How much water is in the tank after 3 minutes? (b) Find both the x- and y-intercepts. Interpret each intercept. (c) Find the slope-intercept form of the equation of the
Solve the inequality. Approximate the endpoints to the nearest thousandth when appropriate. #x - 5.12 = √2x - 5.7(x - 1.1)
Write each percentage in decimal form. (a) -5.5% (b) -1.54% (c) 120% (d) 3 20
Write each percentage in decimal form. (a) 95% (b) 0.321% (c)-175% (d) -%
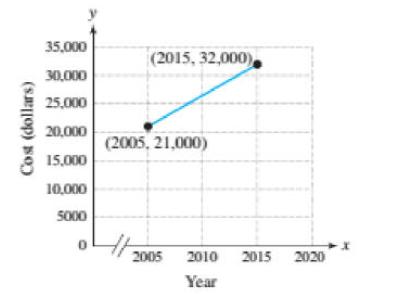
In 2005 the average annual tuition and fees for attending a private college or university was $21,000. This cost rose to about $32,000 in 2015, as illustrated in the figure. (a) Find the slope-intercept form of the line pass- ing through (2005, 21,000) and (2015, 32,000). Interpret the slope. (b)
Write each percentage in decimal form. (a) 35% (b) -0.07% (c) 721% (d) 10
Solve the inequality. Approximate the endpoints to the nearest thousandth when appropriate. 5 < 4x - 2.5
Solve the inequality. Approximate the endpoints to the nearest thousandth when appropriate. 2x85
Solve each inequality numerically. Write the solution set in set-builder or interval notation, and approximate endpoints to the nearest tenth when appropriate. 1.5(x – 0.7) +15x< 1 -
The cost of driving a car includes both fixed costs and mileage costs. Assume that insurance and car payments cost $350 per month and gasoline, oil, and routine maintenance cost $0.29 per mile. (a) Find a linear function f that gives the annual cost of driving this car x miles.(b) What does
Explain how you determine whether a linear function is increasing, decreasing, or constant. Give an example of each.
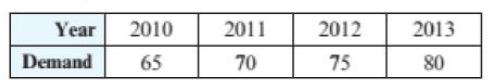
The table lists U.S. demand for green building materials in billions of dollars for selected years.(a) Let x represent the number of years after 2010. Find a formula in slope-intercept form for a linear function f that models the data. (b) Interpret the slope of the graph of y = f(x). (c)
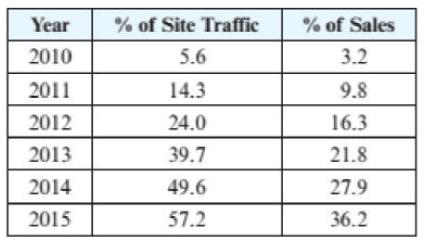
The following table shows mobile device usage by Black Friday shoppers from 2010 to 2015. The middle column lists the percentages of online site traffic due to mobile devices (rather than PCs), and the third column lists the percentages of online sales.Identify the trends in mobile device usage.
In 2011 online sales were $192 billion, and in 2014 they were $249 billion.(a) Find a linear function S that models these data. Write S (x) in slope-intercept form. (b) Interpret the slope of the graph of S. (c) Determine when online sales were $230 billion.
The Celsius C and Fahrenheit F scales are related by C = 5/9(F= 32). These scales have the same temperature reading at a unique value where F = C. Find this temperature.
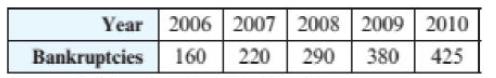
The table lists the number of bank- ruptcies filed in thousands for selected years.(a) Make a scatterplot of the data. (b) Find a formula in point-slope form for a linear function f that models the data. (c) Graph the data and the equation y = f(x) in the same .xy-plane. (d) Interpret the slope
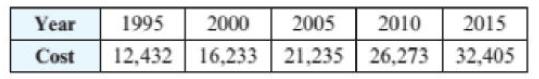
The table lists average tuition and fees in dollars at private colleges for selected years.(a) Make a scatterplot of the data. (b) Find a formula in point-slope form for a linear function f that models the data.(c) Graph the data and the equation y = f(x) in the same xy-plane. (d) Interpret the
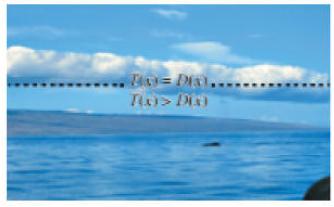
As the altitude increases, both the air temperature and the dew point decrease. As long as the air temperature is greater than the dew point, clouds will not form. Typically, the air temperature T cools at 19°F for each 1-mile increase in altitude and the dew point D decreases by 5.8F for each
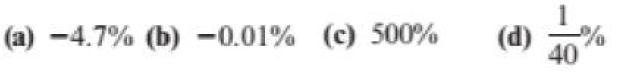
Write each percentage in decimal form. (a) -4.7% (b) -0.01% (c) 500% (d) 40
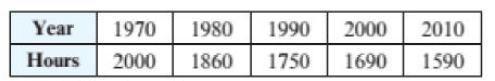
The table lists the annual hours worked by the average worker in Europe for selected years.(a) Let x represent the number of years after 1970. Find a formula in slope-intercept form for a linear function f that models the data. (b) Interpret the slope of the graph of y = f(x). (c) Estimate the
Suppose the Fahrenheit temperature x miles above ground level is given by the formula T(x) = 85 - 19x. (a) Use the intersection-of-graphs method to esti- mate the altitudes where the temperature is below freezing. Assume that the domain of T' is 0 ≤ x ≤ 6. (b) What does the
U.S. Music Albums Sold In 2007 music sales were 500 million albums and in 2015 sales were 240 million albums.(a) Find the slope-intercept form for a line passing through the points (2007, 500) and (2015, 240). (b) Interpret the slope of this line. (c) Estimate sales in 2011 and compare
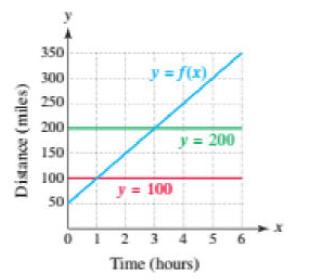
Distance Function f computes the distance y in miles between a car and the city of Omaha after x hours, where 0 ≤ x ≤ 6. The graphs of f and the horizontal lines y = 100 and y = 200 are shown in the figure below. (a) Is the car moving toward or away from Omaha? Explain. (b) Determine the
Write each decimal form in percent form. (a) 0.97 (b) -0.04 (c) 10 (d) 10
Write each decimal form in percent form. (a) 0.37 (b) -0.095 (c) 1.9 (d) 20
Toyota Vehicle Sales In 1998 Toyota sold 1.4 mil- lion vehicles and in 2007 it sold 2.3 million vehicles.(a) Find the point-slope form for a line passing through the points (1998, 1.4) and (2007, 2.3). (b) Interpret the slope of this line. (c) Estimate sales in 2004 and compare them with
(a) Is the graph a horizontal line? (b) Why does the calculator screen appear as it does? Graph y = 1024x + 1 in [0, 3, 1] by [-2,2,1].
Write each decimal form in percent form. (a) -0.121 (b) 1.4 (c) 3.2 (d) 4 4
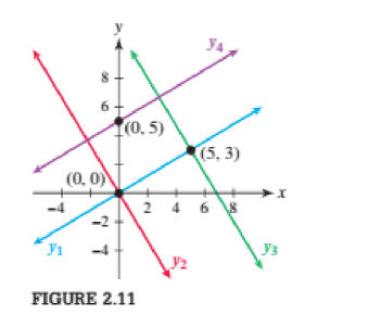
A rectangle is determined by the stated conditions. Find the slope-intercept form of the four lines that outline the rectangle. Vertices (0,0), (2,2), and (1,3)
Solve the given equation for the specified variable. A = LW for W
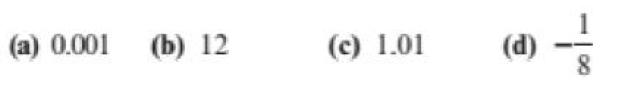
Write each decimal form in percent form. (a) 0.001 (b) 12 (c) 1.01 (d) -1% 8
A rectangle is determined by the stated conditions. Find the slope-intercept form of the four lines that outline the rectangle. Vertices (4,0), (0,4), (0, -4), and (-4, 0)
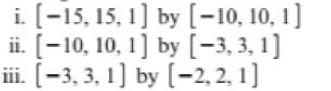
Graph the lines y = 1/2x and y = -x in the standard viewing rectangle. (a) Do the lines appear to be perpendicular?(b) Graph the lines in the following viewing rectangles.Do the lines appear to be perpendicular in any of these viewing rectangles?(c) Determine the viewing rectangles where
U.S. Social Gaming Social gaming revenues (via the Internet) in billions of dollars from 2010 to 2015 were modeled by R(x) = 0.86x + 1.2, where x represents years after 2010.(a) Interpret the slope of the graph of R. (b) Estimate when revenue was more than $3 billion.
A rectangle is determined by the stated conditions. Find the slope-intercept form of the four lines that outline the rectangle. Vertices (1, 1), (5, 1), and (5,5)
Overweight Americans If trends continue, the past and future percentages of the population who are overweight can be estimated by W(x) = x + 45, where x represents years after 1980. (a) Interpret the slope of the graph of W. (b) Estimate when this percentage was between 70% and 77%.
Solve the given equation for the specified variable. E = IR + 2 for R
Solve the given equation for the specified variable. P = 2L + 2W for L
The number of active Facebook users increased from 100 million in 2008 to 1 billion in 2015. (a) Find a formula for a linear function U that models this growth in millions of users, where x is years after 2008. (b) Estimate when the number of users was 485 million or more.
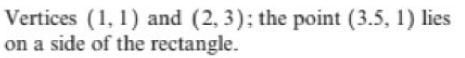
A rectangle is determined by the stated conditions. Find the slope-intercept form of the four lines that outline the rectangle. Vertices (1, 1) and (2, 3); the point (3.5, 1) lies on a side of the rectangle.
The cost of K-12 education per student was $2200 in 1978 and increased to $10,300 in 2008. (a) Find a formula for a linear function C that models this cost in dollars, where x is years after 1978. (b) Estimate when this cost was more than $7600.
Video Sharing In 2006 about 33% of Americans reported watching online videos via sharing sites such as YouTube and Vimeo. By 2011 this number increased to 71%.(a) Find a formula for a linear function that models the data, where x represents the year. (b) Estimate when this percentage was
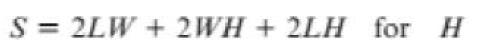
Solve the given equation for the specified variable. H 10 HTC + HMT + MTT = S
Solve the given equation for the specified variable. V = 2mrh + #² for h
Graph y = 1000x + 1000 in the standard window. (a) Is the graph a vertical line? (b) Why does the calculator screen appear as it does?
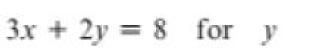
Solve the given equation for the specified variable. 3x + 2y = 8 for y
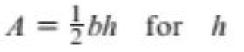
Solve the given equation for the specified variable. A = bh for h {
In 2005 consumers used credit and debit cards to pay for 40% of all purchases. This percentage was 55% in 2011.(a) Find a linear function P that models the data. (b) Estimate when this percentage was between 45% and 50%.
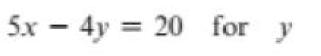
Solve the given equation for the specified variable. 5x - 4y = 20 for y
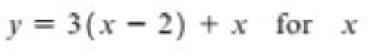
Solve the given equation for the specified variable. y = 3(x-2) + x for x
Find the line of least-squares fit for the given data points. What is the correlation coefficient? Plot the data and graph the line. (-1,-1), (1,4), (2,6)
Find the line of least-squares fit for the given data points. What is the correlation coefficient? Plot the data and graph the line. (-2, 2), (1,0), (3,-2)
In 2011 subscription and streaming music sales were $0.6 billion and in 2016 they increased to $2.4 billion. Use a linear function to predict the years when these music sales might be between $3.12 billion and $4.2 billion.
The equation of a line is written in standard form. (a) Solve the equation for y. (b) Write a formula f(x) for a function whose graph is the given line. 2x + y = 8
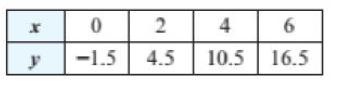
The following data are exactly linear.(a) Find a linear function f that models the data. (b) Solve the inequality f(x) > 2.25. x y 0 2 -1.5 4.5 4 10.5 6 16.5
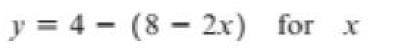
Solve the given equation for the specified variable. y = 4 (8-2x) for x
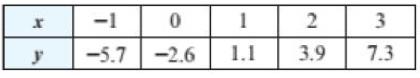
Complete the following. (a) Conjecture whether the correlation coefficient r for the data will be positive, negative, or zero. (b) Use a calculator to find the equation of the least- squares regression line and the value of r. (c) Use the regression line to predict y when x = 2.4. X y -1 0 -5.7
The table lists the percentage P of the female population who had college degrees in selected years.(a) Find a linear function P that models the data. (b) Estimate when this percentage was between 18% and 28.5%. (c) Did your estimate involve interpolation or extrapolation? x 1980 1990 2000 P(%)
The equation of a line is written in standard form. (a) Solve the equation for y. (b) Write a formula f(x) for a function whose graph is the given line. 3x - y = 5 3х у =
A sales associate receives between 6% and 8% of the selling price of a personal tablet. If the selling price of a personal tablet varies between $80 and $200, find the range for the sales associate's commission.
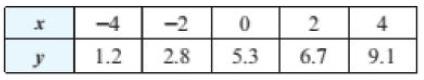
Complete the following. (a) Conjecture whether the correlation coefficient r for the data will be positive, negative, or zero. (b) Use a calculator to find the equation of the least- squares regression line and the value of r. (c) Use the regression line to predict y when x = 2.4.
In Denver, on the 77th day (March 17) the sun rises at 7:00 A.M., and on the 112th day (April 21) the sun rises at 6:00 A.M. Use a linear function to estimate the days when the sun rises between 6:10 A.M. and 6:40 A.M. Do not consider days after April 21.
Suppose that an aluminum can is manufactured so that its radius r can vary from 1.99 inches to 2.01 inches. What range of values is possible for the circumference C of the can? Express your answer by using a three-part inequality. Cola
In Boston, on the 90th day (March 30) the sun rises at 6:30 A.M., and on the 129th day (May 8) the sun rises at 5:30 A.M. Use a linear function to estimate the days when the sun rises between 5:45 A.M. and 6:00 A.M. Do not consider days after May 8.
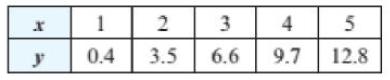
The following data are exactly linear.(a) Find a linear function f that models the data. (b) Solve the inequality 2 ≤ f(x) ≤ 8. 1 2 0.4 3.5 3 45 6.6 9.7 12.8
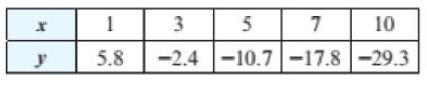
Complete the following. (a) Conjecture whether the correlation coefficient r for the data will be positive, negative, or zero. (b) Use a calculator to find the equation of the least- squares regression line and the value of r. (c) Use the regression line to predict y when x = 2.4. 1 3 5 7 y 5.8
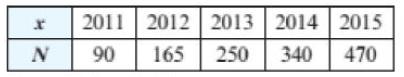
The table lists the number N of tab- lets, such as the iPad, sold worldwide in millions for selected years .x.(a) Find a linear function N that models the data. (b) Estimate when this number is expected to be more than 637 million. (c) Did your estimate involve interpolation or extrapolation?
The equation of a line is written in standard form. (a) Solve the equation for y. (b) Write a formula f(x) for a function whose graph is the given line. 2x - 4y = -1
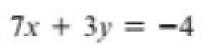
The equation of a line is written in standard form. (a) Solve the equation for y. (b) Write a formula f(x) for a function whose graph is the given line. 7x + 3y = -4
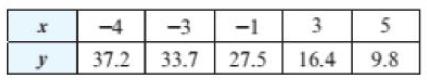
Complete the following. (a) Conjecture whether the correlation coefficient r for the data will be positive, negative, or zero. (b) Use a calculator to find the equation of the least- squares regression line and the value of r. (c) Use the regression line to predict y when x = 2.4. X y -3 -1 37.2
Suppose that a square picture frame has sides that vary between 9.9 inches and 10.1 inches. What range of values is possible for the perimeter P of the picture frame? Express your answer by using a three-part inequality.
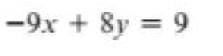
The equation of a line is written in standard form. (a) Solve the equation for y. (b) Write a formula f(x) for a function whose graph is the given line. -9x + 8y = 9
The equation of a line is written in standard form. (a) Solve the equation for y. (b) Write a formula f(x) for a function whose graph is the given line. -2x - 6y = 3
The following table shows mobile device usage by Black Friday shoppers from 2010 to 2015. The middle column lists the percentages of online site traffic due to mobile devices (rather than PCs), and the third column lists the percentages of online sales.Is there any relationship between site traffic
The following table shows mobile device usage by Black Friday shoppers from 2010 to 2015. The middle column lists the percentages of online site traffic due to mobile devices (rather than PCs), and the third column lists the percentages of online sales.Let x be the year and y the percentage of site
The following table shows mobile device usage by Black Friday shoppers from 2010 to 2015. The middle column lists the percentages of online site traffic due to mobile devices (rather than PCs), and the third column lists the percentages of online sales.Let x be the year and y the percentage of
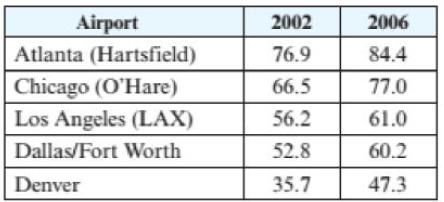
Airline Travel The table lists the numbers of airline passengers in millions at some of the largest airports in the United States during 2002 and 2006.(a) Graph the data by using the 2002 data for x-values and the corresponding 2006 data for y-values. Predict whether the correlation coefficient
The following table shows mobile device usage by Black Friday shoppers from 2010 to 2015. The middle column lists the percentages of online site traffic due to mobile devices (rather than PCs), and the third column lists the percentages of online sales.Let x be the percentage of site traffic and y
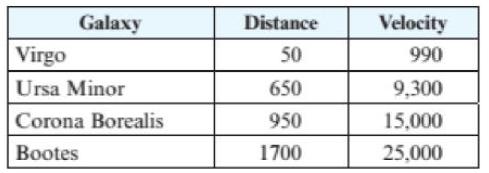
In the late 1920s Edwin P. Hubble (1889-1953) determined both the distance to several galaxies and the velocity at which they were receding from Earth. Four galaxies with their distances in light-years and velocities in miles per second are listed in the table.(a) Let x be distance and y be
The following table shows mobile device usage by Black Friday shoppers from 2010 to 2015. The middle column lists the percentages of online site traffic due to mobile devices (rather than PCs), and the third column lists the percentages of online sales.(Refer to Exercise 117.) For h(x) = ax + b,
The U.S. per capita (per person) income can be modeled by f(x) = 1550 (x - 2011) + 50,000, where x is the year. Determine the year when the per capita income might be $62,400.
Describe how to numerically solve the linear inequality ax + b ≤ 0. Give an example.
Tuition and fees x years after 2000 at private colleges can be modeled by f(x) = 1080x + 16,200. Use f(x) to determine when tuition and fees might reach $37,800.
If you multiply each part of a three-part inequality by the same negative number, what must you make sure to do? Explain by using an example.
During the 1980s, sales of compact discs surpassed vinyl record sales. From 1985 to 1990, sales of compact discs in millions can be modeled by the formula f(x) = 51.6(x - 1985) + 9.1. whereas sales of vinyl LP records in millions can be modeled by g(x) = 31.9 (x - 1985) + 167.7. Approximate the
The median age A in the United States during year x, where 2000 x 2050, is projected to be A(x) = 0.07 x 104.7. Use A (x) to estimate when the median age may reach 37 years.
Explain how a linear function, a linear equation, and a linear inequality are related. Give an example.
A rectangular window has a length that is 18 inches more than its width. If its perimeter is 180 inches, find its dimensions.
In 2000 the population density of the United States was 80 people per square mile, and in 2011 it was 88 people per square mile. Use a linear function to estimate when the U.S. population density reached 91 people per square mile.
A store is discounting all regularly priced merchandise by 25%. Find a function f that computes the sale price of an item having a regular price of x. If an item normally costs $56.24, what is its sale price?
Continuing Exercise 121, use to find the regular price of an item that costs $19.62 on sale.Data from Exercise 121:A store is discounting all regularly priced merchandise by 25%. Find a function f that computes the sale price of an item having a regular price of x. If an item normally costs
Compare the slope-intercept form with the point- slope form. Give examples of each.
Explain how you would find the equation of a line passing through two points. Give an example.
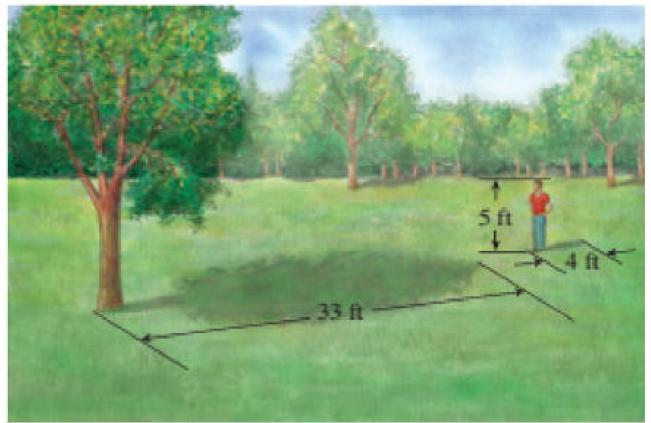
In the accompanying figure, a person 5 feet tall casts a shadow 4 feet long. A nearby tree casts a shadow 33 feet long. Find the height of the tree by solving a linear equation. 33升 5t
Skin Cancer Approximately 4.3% of all cancer cases diagnosed in 2016 were melanoma. (a) If x cases of cancer were diagnosed, how many of these were melanoma? (b) There were a total of 73,000 cases of melanoma diagnosed in 2016. Find the total number of cancer cases in 2016.
Showing 11900 - 12000
of 13634
First
113
114
115
116
117
118
119
120
121
122
123
124
125
126
127
Last
Step by Step Answers