New Semester
Started
Get
50% OFF
Study Help!
--h --m --s
Claim Now
Question Answers
Textbooks
Find textbooks, questions and answers
Oops, something went wrong!
Change your search query and then try again
S
Books
FREE
Study Help
Expert Questions
Accounting
General Management
Mathematics
Finance
Organizational Behaviour
Law
Physics
Operating System
Management Leadership
Sociology
Programming
Marketing
Database
Computer Network
Economics
Textbooks Solutions
Accounting
Managerial Accounting
Management Leadership
Cost Accounting
Statistics
Business Law
Corporate Finance
Finance
Economics
Auditing
Tutors
Online Tutors
Find a Tutor
Hire a Tutor
Become a Tutor
AI Tutor
AI Study Planner
NEW
Sell Books
Search
Search
Sign In
Register
study help
mathematics
college algebra graphs and models
College Algebra With Modeling And Visualization 6th Edition Gary Rockswold - Solutions
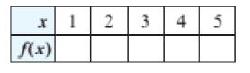
Complete the following. (a) Evaluate f(x) for each x-value in the table.(b) Calculate the average rate of change of f between consecutive data points in the table. (c) Find the difference quotient for f(x). Then let h = 1 n the difference quotient. (d) Evaluate this difference quotient for x =
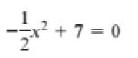
Solve the quadratic equation. Check your answers. +܀ +7= 0
Solve the quadratic equation. Check your answers. x² + 3x + 2 = 0
Simplify by using the imaginary unit i. V-12
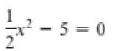
Solve the quadratic equation. Check your answers. 2
Simplify by using the imaginary unit i. -32
Complete the following. (a) Evaluate f(x) for each x-value in the table.(b) Calculate the average rate of change of f between consecutive data points in the table. (c) Find the difference quotient for f(x). Then let h = 1 n the difference quotient. (d) Evaluate this difference quotient for x =
Identify f as being linear, quadratic, or neither. If f is quadratic, identify the leading coefficient a and evaluate f(-2). zx² = (x)ƒ
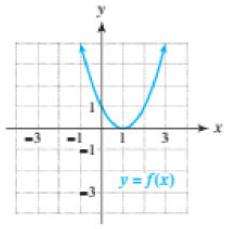
Use the graph to find the following. (a) Sign of the leading coefficient (b) Vertex (c) Axis of symmetry (d) Intervals where f is increasing and where f is decreasing (e) Domain and range in interval notation -3 3 y = f(x)
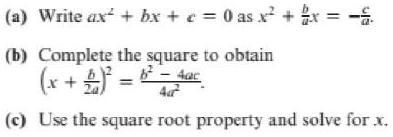
Prove the quadratic formula by completing the following. (a) Write ax + bx + c = 0 as x² + x = -£ (b) Complete the square to obtain b² - 4ac (x + 2)² = 47² (c) Use the square root property and solve for x.
Solve the quadratic equation. Check your answers. 3r² - 27 = 0
Identify f as being linear, quadratic, or neither. If f is quadratic, identify the leading coefficient a and evaluate f(-2). f(x) = 1/-³/x 10
Simplify by using the imaginary unit i. -11
Identify f as being linear, quadratic, or neither. If f is quadratic, identify the leading coefficient a and evaluate f(-2). f(x) = (x² + 1)²
Simplify by using the imaginary unit i. -23
Solve the quadratic equation. Check your answers. 2x²-32= 0
Complete the following. (a) Evaluate f(x) for each x-value in the table.(b) Calculate the average rate of change of f between consecutive data points in the table. (c) Find the difference quotient for f(x). Then let h = 1 n the difference quotient. (d) Evaluate this difference quotient for x =
Use the fact that √x2 = |x| to show that the solutions to x2 = k with k > 0 are given by x = ±√k.
Simplify by using the imaginary unit i. V-49
Solve the quadratic equation. Check your answers. x² +13=0
For each equation, calculate the discriminant. Use the discriminant to decide whether the equation can be solved by factoring. If it can, solve the equation by factoring. Otherwise, use the quadratic formula. 3x² - 2x-4-0 4=
For each equation, calculate the discriminant. Use the discriminant to decide whether the equation can be solved by factoring. If it can, solve the equation by factoring. Otherwise, use the quadratic formula. 5x²-3x - 30
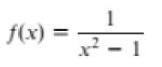
Identify f as being linear, quadratic, or neither. If f is quadratic, identify the leading coefficient a and evaluate f(-2). 1 ?-1 fx) = -
Simplify by using the imaginary unit i. V-100
Solve the quadratic equation. Check your answers. 0 = 11 + x
Simplify by using the imaginary unit i. V-16
Complete the following. (a) Evaluate f(x) for each x-value in the table.(b) Calculate the average rate of change of f between consecutive data points in the table. (c) Find the difference quotient for f(x). Then let h = 1 n the difference quotient. (d) Evaluate this difference quotient for x =
Identify f as being linear, quadratic, or neither. If f is quadratic, identify the leading coefficient a and evaluate f(-2). f(x) = -5x + 11
Identify f as being linear, quadratic, or neither. If f is quadratic, identify the leading coefficient a and evaluate f(-2). f(x) = 1 - 2x + 3x²
Solve the quadratic equation. Check your answers. 6=zx
Solve the quadratic equation. Check your answers. x² = 4
For each equation, calculate the discriminant. Use the discriminant to decide whether the equation can be solved by factoring. If it can, solve the equation by factoring. Otherwise, use the quadratic formula. 15x²17x4=0
Simplify by using the imaginary unit i. -4
For each equation, calculate the discriminant. Use the discriminant to decide whether the equation can be solved by factoring. If it can, solve the equation by factoring. Otherwise, use the quadratic formula. 8x²14x 15 = 0
The properties of the imaginary unit are i = √-1 and i2 = -1. (a) Begin simplifying the expressions i, i2, i3, i4, i5,..... until a simple pattern is discovered. For example, i3 = i · i2 = i · (-1) = -i. (b) Summarize your findings by describing how to simplify in for
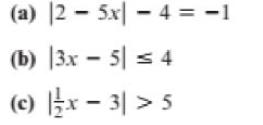
Solve each equation or inequality. For each inequality, write the solution set in interval notation. (a) |25x|-4 = -1 (b) |3x - 5 ≤ 4 (c) |x-3 > 5
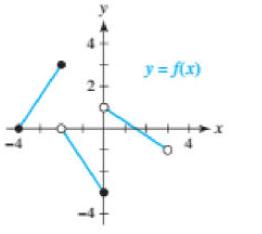
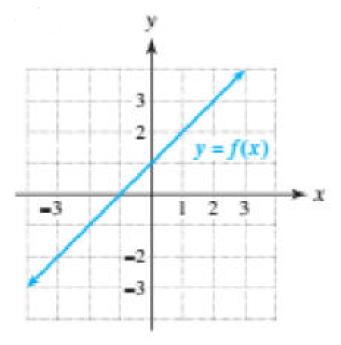
Use the graph of y = f(x) to write a formula for f. Write each piece in slope-piecewise-defined intercept form. y = f(x)
Use the graph of y = f(x) to solve each equation. (a) f(x) = -1 (b) f(x) = 0 (c) f(x) = 2
Use the x-intercept method to solve the inequality. Write the solution set in set-builder or interval notation. Then check your answer by solving the inequality symbolically. x-2≤ x
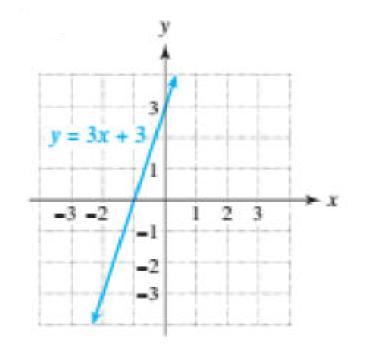
Use the graph of y = ax + b at the top of the next column to solve each equation and inequality. Write the solution set to each inequality in set-builder or interval notation. (a) ax + b = 0 (b) ax + b
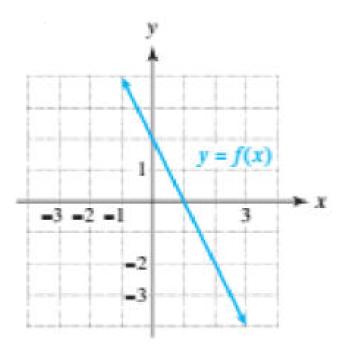
Use the graph of y = f(x) to solve each equation. (a) f(x) = -1 (b) f(x) = 0 (c) f(x) = 2
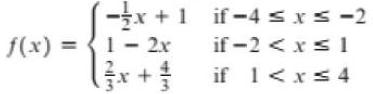
Find Graph f. -x+1 f(x) = 1-2x 3x + if-4≤x≤ -2 if-2 < x≤1 if 1 < x≤ 4
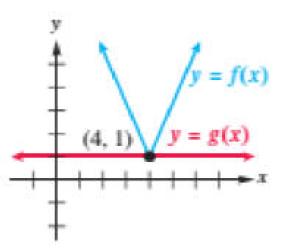
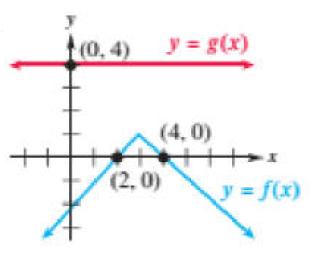
Use the graph, along with the indicated points, to give the solutions to each of the following. (a) f(x) = g(x) (b) f(x) < g(x) (c) f(x) > g(x)
Use the graph, along with the indicated points, to give the solutions to each of the following. (a) f(x) = g(x) (b) f(x) < g(x) (c) f(x) > g(x)
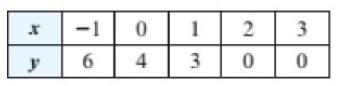
The table represents a relation S.(a) Does S represent a function? (b) Determine the domain and range of S. 형 -1 6 0 1 4 3 2 0 3 0
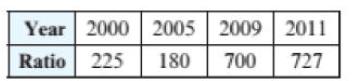
One way to describe the housing market is to divide the population of the United States by the number of new housing starts. This ratio is listed in the following table for selected years.(a) Plot a line graph of these data. Let this graph be function R. (b) Evaluate R (2009) and interpret the
Complete the following. (a) Use dot mode to graph the function f in the standard viewing rectangle. (b) Evaluate f(-3.1) and f(1.7). f(x) = [2x - 1]
Use the x-intercept method to solve the inequality. Write the solution set in set-builder or interval notation. Then check your answer by solving the inequality symbolically. x-3≤x-2
Find an equation of the line satisfying the conditions. If possible, for each line write a formula for a linear function whose graph is the line. Parallel to x = 4.5, passing through (19, 5.5)
Complete the following. (a) Use dot mode to graph the function f in the standard viewing rectangle. (b) Evaluate f(-3.1) and f(1.7). [1 + x] = (x)ƒ
Complete the following. (a) Use dot mode to graph the function f in the standard viewing rectangle. (b) Evaluate f(-3.1) and f(1.7). f(x) = [x] + 1
Determine the x- and y-intercepts on the graph of the equation. Graph the equation. -3x - 5y = 15
Find an equation of the line satisfying the conditions. If possible, for each line write a formula for a linear function whose graph is the line. Parallel to y = -2.5, passing through (1985, 67)
Determine the x-and y-intercepts on the graph of the equation. Graph the equation. 4x - 5y = 20
Write a formula for a linear function f whose graph has slope -2 and passes through (-2, 3).
Use the intersection-of-graphs method to solve the equation. Then solve symbolically. x + 4 = 1 - 2x
Solve the equation (a) Graphically, (b) Numerically, (c) Symbolically. Then solve the related inequality. |4x4 = 8, 4x 4 ≤ 8
Use the x-intercept method to solve the inequality. Write the solution set in set-builder or interval notation. Then check your answer by solving the inequality symbolically. 2-x < 3x-2
Use the x-intercept method to solve the inequality. Write the solution set in set-builder or interval notation. Then check your answer by solving the inequality symbolically. 1 = x² < 1 + x²
Solve the equation (a) Graphically, (b) Numerically, (c) Symbolically. Then solve the related inequality. |2x 5 = 10, 2x - 5 < 10 -
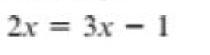
Use the intersection-of-graphs method to solve the equation. Then solve symbolically. 2x = 3x - 1
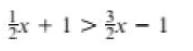
Solve the linear inequality graphically. Write the solution set in set-builder notation. Approximate endpoints to the nearest hundredth whenever appropriate. 5x − 4 > 10 42
Complete the following. (a) Use dot mode to graph the function f in the standard viewing rectangle. (b) Evaluate f(-3.1) and f(1.7). f(x) = [-x]
Determine the x-and y-intercepts on the graph of the equation. Graph the equation. x=y=7
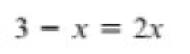
Use the intersection-of-graphs method to solve the equation. Then solve symbolically. 3 = x= 2x
Use the intersection-of-graphs method to solve the equation. Then solve symbolically. x = 4-x
Solve the equation (a) Graphically, (b) Numerically, and (c) Symbolically. Then solve the related inequality. |63x| = 3, 16-3x > 3
Determine the x-and y-intercepts on the graph of the equation. Graph the equation. 6x - 7y = -42
Determine the x-and y-intercepts on the graph of the equation. Graph the equation. 15x - y = 30
Solve the linear inequality graphically. Write the solution set in set-builder notation. Approximate endpoints to the nearest hundredth whenever appropriate. -3x+69
Solve the linear inequality graphically. Write the solution set in set-builder notation. Approximate endpoints to the nearest hundredth whenever appropriate. 09 SS + (0661 - x)2-
Use the intersection-of-graphs method to solve the equation. Then solve symbolically. XE = f + X=
Use the intersection-of-graphs method to solve the equation. Then solve symbolically. 1-2x = x + 4
In 1980 the median family income was $17,700 and in 2010 it was $49,500. (a) Find a linear function of that models these data. Let x represent the number of years after 1980. (b) Interpret the slope and y-intercept for the graph of f. (c) Estimate the median income in 1992 and
Determine the x- and y-intercepts on the graph of the equation. Graph the equation. 5x + 2y = -20
Determine the x-and y-intercepts on the graph of the equation. Graph the equation. - 3x = 7
Solve the linear inequality graphically. Write the solution set in set-builder notation. Approximate endpoints to the nearest hundredth whenever appropriate. √2x> 10.5 - 13.7x
Use the intersection-of-graphs method to solve the equation. Then solve symbolically. 2(x - 1)2 = x
Each foot of carpet purchased from a 12-foot-wide roll costs $36. If a fraction of a foot is purchased, a customer does not pay for the extra amount. For example, if a customer wants 14 feet of carpet and the salesperson cuts off 14 feet 4 inches, the customer does not pay for the extra 4
In order to receive a B grade in a college course, it is necessary to have an overall average of 80% correct on two 1-hour exams of 75 points each and one final exam of 150 points. If a person scores 55 and 72 on the 1-hour exams, what is the minimum score that the person can receive on the final
In 2010 Medicare spending was $524 billion and in 2020 it is projected to be $949 bil- lion. (a) Find a linear function f that models these data. Let x represent the number of years after 2010. (b) Interpret the slope and y-intercept for the graph of f. (c) Estimate Medicare spending
Solve the linear inequality graphically. Write the solution set in set-builder notation. Approximate endpoints to the nearest hundredth whenever appropriate. √5(x-1.2) -√3x < 5(x + 1.1)
Let y vary directly with x. Complete the following.Find y when x = 5, if y = 7 when x = 14.
Solve the inequality. Write the solution in interval notation. |-3-6x > 9
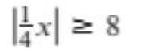
Solve the inequality. Write the solution in interval notation. 12지 = 8
Solve the inequality. Write the solution in interval notation. |-5x2| = -2
Solve the inequality. Write the solution in interval notation. 18-2x = 10
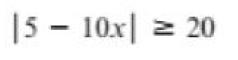
Solve the inequality. Write the solution in interval notation. 15 - 10x ≥ 20
Let y vary directly with x. Complete the following.Find y when x = 2.5, if y = 13 when x = 10.
Solve the inequality. Write the solution in interval notation. |4x + 1 =
Solve the inequality. Write the solution in interval notation. |x + 11-12-2
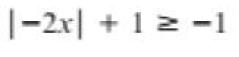
Solve the inequality. Write the solution in interval notation. 1- = 1 + |³7-|
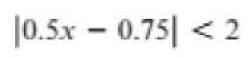
Solve the inequality. Write the solution in interval notation. |0.5x – 0.75| < 2
Solve the inequality. Write the solution in interval notation. |-7x3 ≥ 5
Solve the inequality. Write the solution in interval notation. |2x - 3| > 1
Solve the inequality. Write the solution in interval notation. |5x - 7기 > 2
Solve the inequality. Write the solution in interval notation. |=0.5.x + 5| ≥ 4
Solve the inequality. Write the solution in interval notation. |2.1x - 5 = 8
Solve the inequality. Write the solution in interval notation. |-3x + 8 ≥ 3
Solve the inequality. Write the solution in interval notation. 10.25x - 1 > 3
Showing 10900 - 11000
of 13634
First
103
104
105
106
107
108
109
110
111
112
113
114
115
116
117
Last
Step by Step Answers