New Semester
Started
Get
50% OFF
Study Help!
--h --m --s
Claim Now
Question Answers
Textbooks
Find textbooks, questions and answers
Oops, something went wrong!
Change your search query and then try again
S
Books
FREE
Study Help
Expert Questions
Accounting
General Management
Mathematics
Finance
Organizational Behaviour
Law
Physics
Operating System
Management Leadership
Sociology
Programming
Marketing
Database
Computer Network
Economics
Textbooks Solutions
Accounting
Managerial Accounting
Management Leadership
Cost Accounting
Statistics
Business Law
Corporate Finance
Finance
Economics
Auditing
Tutors
Online Tutors
Find a Tutor
Hire a Tutor
Become a Tutor
AI Tutor
AI Study Planner
NEW
Sell Books
Search
Search
Sign In
Register
study help
mathematics
elementary statistics excel
Elementary Statistics Using Excel 6th Edition Mario F. Triola - Solutions
When randomly selecting adults, let M denote the event of randomly selecting a male and let B denote the event of randomly selecting someone with blue eyes. What does P(M\B) represent? Is P(M\B) the same as P(M\B)?
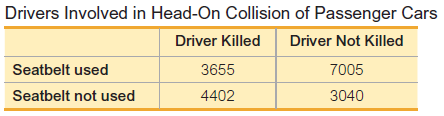
Find the probability of randomly selecting a driver and getting one who was not killed given that the driver was using a seatbelt. Use the data in the accompanying table and express all results in decimal form. (The data are from ?Mortality Reduction with Air Bag and Seat Belt Use in Head-On
In the New Jersey Pick 6 lottery game, a bettor selects six different numbers, each between 1 and 49. Winning the top prize requires that the selected numbers match those that are drawn, but the order does not matter. Do calculations for winning this lottery involve permutations or combinations?
Let A = the event of getting at least one defective iPhone when 3 iPhones are randomly selected with replacement from a batch. Write a statement describing event A̅.
Standard tests, such as the SAT or ACT or MCAT, tend to make extensive use of multiple-choice questions because they are easy to grade using software. If one such multiple choice question has possible correct answers of a, b, c, d, e, what is the probability of a wrong answer if the answer is a
Let A denote the event of placing a $1 straight bet on the New Jersey Pick 3 lottery and winning. There are 1000 different ways that you can select the three digits (with repetition allowed) in this lottery, and only one of those three-digit numbers will be the winner. What is the value of P(A)?
When randomly selecting an adult, A denotes the event of selecting someone with blue eyes. What do P(A) and P(A̅) represent?
If one driver is randomly selected, find the probability he or she was using a seatbelt. Use the data in the accompanying table and express all results in decimal form. (The data are from ?Mortality Reduction with Air Bag and Seat Belt Use in Head-On Passenger Car Collisions,? by Crandall, Olson,
What does the symbol ! represent? Six different people can stand in a line 6! different ways, so what is the actual number of ways that six people can stand in a line?
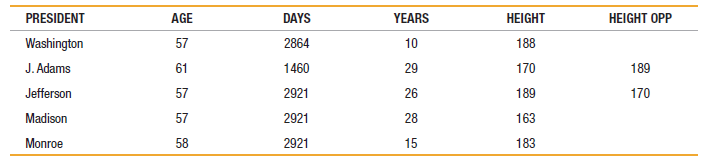
Data Set 15 ?Presidents? in Appendix B lists the numbers of years that U.S. presidents lived after their first inauguration. As of this writing, five of the presidents are still alive and after their first inauguration they have lived 37 years, 25 years, 21 years, 13 years, and 5 years so far. We
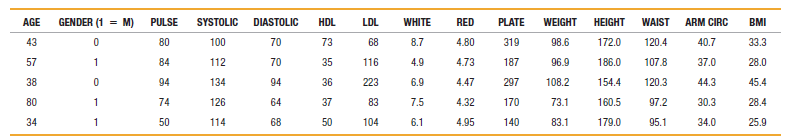
Five pulse rates randomly selected from Data Set 1 ?Body Data? in Appendix B have a mean of 78.0 beats per minute. Four of the pulse rates are 82, 78, 56, and 84. a. Find the missing value. b. We need to create a list of n values that have a specific known mean. We are free to select any values we
The following are the ratings of males by females in an experiment involving speed dating.Use the given data to construct a boxplot and identify the 5-number summary.
Use the same list of Sprint airport data speeds (Mbps) given for this exercise. Find the indicated percentile or quartile.P85
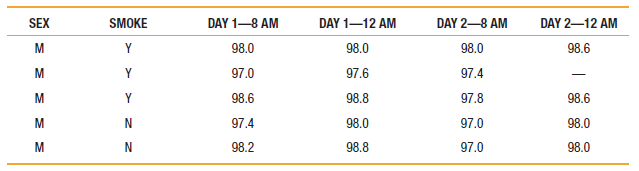
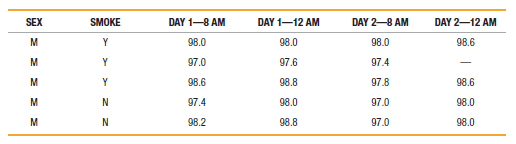
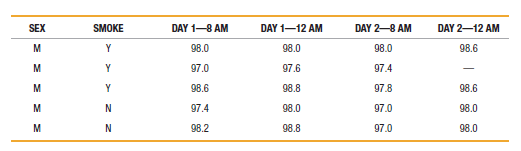
Refer to Data Set 3 ?Body Temperature? in Appendix B and use the body temperatures for 12:00 AM on day 2. Refer to the indicated data set in Appendix B. Use software or a calculator to find the range, variance, and standard deviation. Express answers using appropriate units, such as
Refer to Data Set 3 ?Body Temperatures? in Appendix B and use the body temperatures for 12:00 AM on day 2. Do the results support or contradict the common belief that the mean body temperature is 98.6oF? Refer to the indicated data set in Appendix B. Use software or a calculator to find the means
Use the same list of Sprint airport data speeds (Mbps) given for this exercise. Find the indicated percentile or quartile.P25
Use the same list of Sprint airport data speeds (Mbps) given for this exercise. Find the indicated percentile or quartile.P75
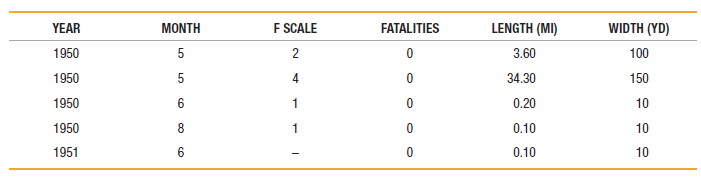
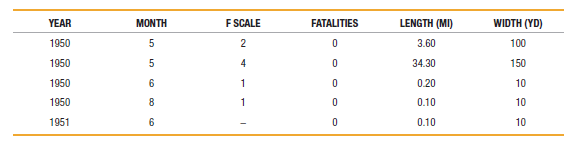
Use the F-scale measurements from the tornadoes listed in Data Set 22 ?Tornadoes? in Appendix B. Be careful to account for missing data. Refer to the indicated data set in Appendix B. Use software or a calculator to find the range, variance, and standard deviation. Express answers using
Use the F-scale measurements from the tornadoes listed in Data Set 22 ?Tornadoes? in Appendix B. Among the 500 tornadoes, how many have missing F-scale measurements? (Caution: In some technologies, missing data are represented by a constant such as -9 or 9999.) Refer to the indicated data set in
Use the same list of Sprint airport data speeds (Mbps) given for this exercise. Find the indicated percentile or quartile.P50
Use the same list of Sprint airport data speeds (Mbps) given for this exercise. Find the indicated percentile or quartile.P40
Use the same list of Sprint airport data speeds (Mbps) given for this exercise. Find the indicated percentile or quartile.Q3
Use the same list of Sprint airport data speeds (Mbps) given for this exercise. Find the indicated percentile or quartile.Q1
Use the same list of Sprint airport data speeds (Mbps) given for this exercise. Find the indicated percentile or quartile.P60
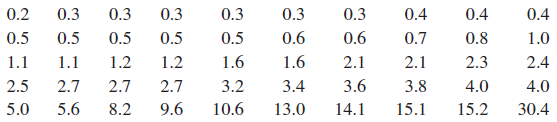
Use the following cell phone airport data speeds (Mbps) from Sprint. Find the percentile corresponding to the given data speed. 9.6 Mbps 0.2 0.5 0.3 0.5 0.3 0.3 0.6 0.3 0.3 0.3 0.5 0.4 0.4 0.4 0.5 0.5 0.6 0.7 0.8 2.3 1.0 1.6 3.2 10.6 1.6 1.1 1.1 2.7 1.2 2.7 2.7 8.2 9.6 1.2 2.1 3.6 2.1 2.4 2.5 3.8
Use the following cell phone airport data speeds (Mbps) from Sprint. Find the percentile corresponding to the given data speed. 0.7 Mbps 0.2 0.5 0.3 0.5 0.3 0.3 0.6 0.3 0.3 0.3 0.5 0.4 0.4 0.4 0.5 0.5 0.6 0.7 0.8 2.3 1.0 1.6 3.2 10.6 1.6 1.1 1.1 2.7 1.2 2.7 2.7 8.2 9.6 1.2 2.1 3.6 2.1 2.4 2.5 3.8
Use the following cell phone airport data speeds (Mbps) from Sprint. Find the percentile corresponding to the given data speed. 13.0 Mbps 0.2 0.5 0.3 0.5 0.3 0.3 0.6 0.3 0.3 0.3 0.5 0.4 0.4 0.4 0.5 0.5 0.6 0.7 0.8 2.3 1.0 1.6 3.2 10.6 1.6 1.1 1.1 2.7 1.2 2.7 2.7 8.2 9.6 1.2 2.1 3.6 2.1 2.4 2.5
Use the following cell phone airport data speeds (Mbps) from Sprint. Find the percentile corresponding to the given data speed. 2.4 Mbps 0.2 0.5 0.3 0.5 0.3 0.3 0.6 0.3 0.3 0.3 0.5 0.4 0.4 0.4 0.5 0.5 0.6 0.7 0.8 2.3 1.0 1.6 3.2 10.6 1.6 1.1 1.1 2.7 1.2 2.7 2.7 8.2 9.6 1.2 2.1 3.6 2.1 2.4 2.5 3.8
In the 87th Academy Awards, Eddie Redmayne won for best actor at the age of 33 and Julianne Moore won for best actress at the age of 54. For all best actors, the mean age is 44.1 years and the standard deviation is 8.9 years. For all best actresses, the mean age is 36.2 years and the standard
Consider a sample of sleep times taken from the population of all adults living in Alaska. Identify the symbols used for the sample mean, population mean, sample standard deviation, population standard deviation, sample variance, and the population variance.
In a recent year, scores on the Medical College Admission Test (MCAT) had a mean of 25.2 and a standard deviation of 6.4. Identify the MCAT scores that are significantly low or significantly high.Consider a value to be significantly low if its z score is less than or equal to -2 or consider the
For a sample of 100 sleep times, give the names of the values that constitute the 5-number summary. (The actual values can’t be identified; just give the names of those values.)
A large sample of sleep times includes values ranging from a low of 4 hours to a high of 10 hours. Use the range rule of thumb to estimate the standard deviation.
For a sample of 80 sleep times, approximately how many of those times are less than Q3?
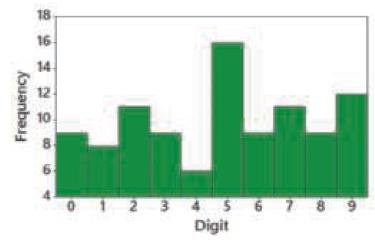
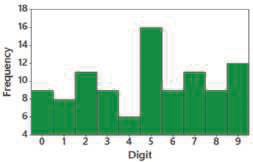
Examine the distribution shown in the histogram from Exercise 5. Does it appear that the sample data are from a population with a normal distribution? Why or why not?Exercise 5 18 16 14 12 10 2 3 7 8 456 Digit Kouanba
A larger sample of 50 sleep times (hours) has a mean of 6.3 hours and a standard deviation of 1.4 hours. What is the z score for a sleep time of 5 hours?
The accompanying histogram depicts outcomes of digits from the Florida Play 4 lottery. What is the major flaw in this histogram? 18 16 14 12 10 8. 01 2 3 45 6 7 8 9 Digit Kouanbas
If the sleep time of 0 hours is included with the sample data given in Exercise 1, is it an outlier? Why or why not?Exercise 1As part of the National Health and Nutrition Examination Survey, subjects were asked how long they slept the preceding night, and the following times (hours) were
The standard deviation of the sample values in Exercise 1 is 1.3 hours. What is the variance (including units)?Exercise 1As part of the National Health and Nutrition Examination Survey, subjects were asked how long they slept the preceding night, and the following times (hours) were reported:8, 7,
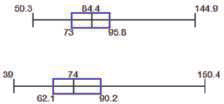
Refer to the boxplots shown below that are drawn on the same scale. One boxplot represents weights of men, and the other boxplot represents weights of women. Which boxplot represents weights ofwomen? Explain.? 50.3 844 144.9 30 160.4 62. D0.2
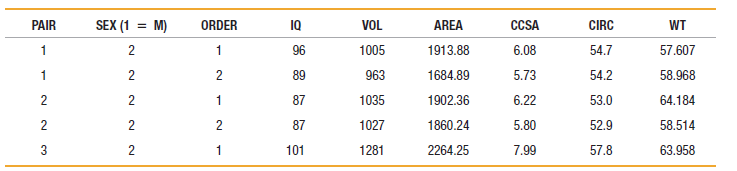
The 20 subjects used in Data Set 8 ?IQ and Brain Size? in Appendix B have weights with a standard deviation of 20.0414 kg. What is the variance of their weights? Be sure to include the appropriate units with the result. Data set 8 SEX (1 = M) 2 AREA 1913.88 PAIR WT CCSA 6.08 5.73 ORDER 1Q VOL
In what sense are the mean, median, mode, and midrange measures of “center”?
What is the mode of the sample values listed in Exercise 1?Exercise 1As part of the National Health and Nutrition Examination Survey, subjects were asked how long they slept the preceding night, and the following times (hours) were reported:8, 7, 5, 7, 4, 7, 6, 7, 8, 8, 8, 6.Find the mean.
What is the median of the sample values listed in Exercise 1?Exercise 1As part of the National Health and Nutrition Examination Survey, subjects were asked how long they slept the preceding night, and the following times (hours) were reported:8, 7, 5, 7, 4, 7, 6, 7, 8, 8, 8, 6.Find the mean.
LeBron James, one of the most successful basketball players of all time, has a height of 6 feet 8 inches, or 203 cm. Based on statistics from Data Set 1 “Body Data” in Appendix B, his height converts to the z score of 4.07. How many standard deviations is his height above the mean?
As part of the National Health and Nutrition Examination Survey, subjects were asked how long they slept the preceding night, and the following times (hours) were reported:8, 7, 5, 7, 4, 7, 6, 7, 8, 8, 8, 6.Find the mean.
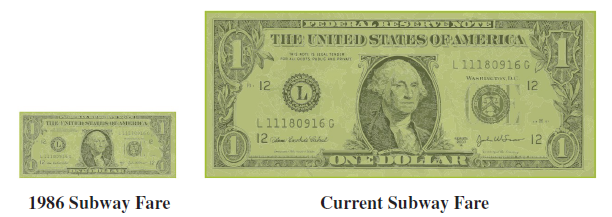
In 1986, the New York City subway fare cost $1, and as of this writing, the current cost is $2.50, so the 1986 price was multiplied by 2.5. In the accompanying graph, the large bill is 2.5 times as tall and 2.5 times as wide as the smaller bill. Identify how the graph is deceptive. PEDEHALRES
A histogram is to be constructed from the measured breaking points (in pounds) of tested car seatbelts. Identify two key features of a histogram of those values that would suggest that the data have a normal distribution.
The Beams Seatbelts company manufactures—well, you know. When a sample of seatbelts is tested for breaking point (measured in kilograms), the sample data are explored. Identify the important characteristic of data that is missing from this list: center, distribution, outliers, changing
How would the shape of the histogram change if the vertical scale uses relative frequencies expressed in percentages instead of the actual frequency counts as shown here?
Give the approximate values of the class width, and the lower and upper class limits of the class depicted in the bar farthest to the left.
a. After collecting the average (mean) global temperatures for each of the most recent 100 years, we want to construct the graph that is most appropriate for these data. Which graph is best?b. After collecting the average (mean) global temperature and the amount of carbon monoxide emissions for the
In recent years, there has been much discussion about the distribution of wealth of adults in the United States. If you plan to conduct original research by somehow obtaining the amounts of wealth of 3000 randomly selected adults, what graph would be best for illustrating the distribution of wealth?
What is the approximate number of quarters depicted in the three bars farthest to the left?
Use the total game playing times to create a stemplot. What does the stemplot reveal about the distribution of the data?
As a quality control manager at Texas Instruments, you find that defective calculators have various causes, including worn machinery, human error, bad supplies, and packaging mistreatment. Which of the following graphs would be best for describing the causes of defects: histogram; scatterplot;
If we collect a sample of blood platelet counts much larger than the sample included with Exercise 3, and if our sample includes a single outlier, how will that outlier appear in a histogram? Exercise 3 Listed below are blood platelet counts (1000 cells/?L) randomly selected from adults in the
Assume that you want to create the histogram for Exercise 3 in a way that exaggerates the differences among the times. Describe how the histogram from Exercise 3 can be modified to accomplish that exaggeration. 236 237 238 239 241 241 242 245 245 245 246 247 247 248 248 249 250 250 250 251 252 252
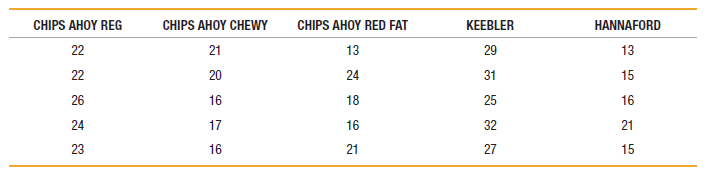
A stemplot of the same cookies summarized in Exercise 1 is created, and the first row of that stemplot is 1 | 99. Identify the values represented by that row of the stemplot.Data from Exercise 1 ChocolateChips ......................
For each of the following, estimate the value of the linear correlation coefficient r for the given paired data obtained from 50 randomly selected adults.a. Their heights are measured in inches (x) and those same heights are recorded in centimeters (y).b. Their IQ scores (x) are measured and their
Listed below are blood platelet counts (1000 cells/?L) randomly selected from adults in the United States. Why does it not make sense to construct a histogram for this data set? 191 286 263 193 193 215 162 646 250 386
Using the same frequency distribution from Exercise 1, how many cookies are included? ChocolateChips ...................... Frequency18–20 ............................... 621–23 ............................... 1124–26
What is a scatterplot and how does it help us?
The population of heights of adult males is normally distributed. If we obtain a voluntary response sample of 5000 of those heights, will a histogram of the sample heights be bell-shaped?
For the frequency distribution from Exercise 1, find the following.a. Class limits of the first classb. Class boundaries of the first classc. Class midpoint of the first class
Using the same frequency distribution from Exercise 1, identify the class boundaries of the first class and identify the class limits of the first class. ChocolateChips ...................... Frequency18–20
Refer to the accompanying frequency distribution that summarizes the numbers of chocolate chips found in each cookie in a sample of Chips Ahoy regular chocolate chip cookies (from Data Set 28 ?Chocolate Chip Cookies? in Appendix B). What is the class width? Is it possible to identify the original
A study has shown that there is a correlation between body weight and blood pressure. Higher body weights are associated with higher blood pressure levels. Can we conclude that gaining weight is a cause of increased blood pressure?
Heights of adult males are normally distributed. If a large sample of heights of adult males is randomly selected and the heights are illustrated in a histogram, what is the shape of that histogram?
Refer to the accompanying table summarizing service times (seconds) of McDonald’s dinners. How many individuals are included in the summary? Is it possible to identify the exact values of all of the original service times?McDonald’s Dinner Service TimesTime (sec) .......................
In this section we use r to denote the value of the linear correlation coefficient. Why do we refer to this correlation coefficient as being linear?
When the author was negotiating a contract for the faculty and administration at a college, a dean presented the argument that if faculty receive a 4% raise and administrators receive a 4% raise, that’s an 8% raise and it would never be approved. What’s wrong with that argument?
The HIV Trials Network is conducting a study to test the effectiveness of two different experimental HIV vaccines. Subjects will consist of 80 pairs of twins. For each pair of twins, one of the subjects will be treated with the DNA vaccine and the other twin will be treated with the adenoviral
A New York Times editorial criticized a chart caption that described a dental rinse as one that “reduces plaque on teeth by over 300%.” What is wrong with this statement?Answer the given questions, which are related to percentages.
Currently, there is no approved vaccine for the prevention of infection by West Nile virus. A clinical trial of a possible vaccine is being planned to include subjects treated with the vaccine while other subjects are given a placebo.Identify which of these designs is most appropriate for the given
Continental Airlines ran ads claiming that lost baggage is “an area where we’ve already improved 100% in the past six months.” What is wrong with this statement?Answer the given questions, which are related to percentages.
A clinical trial of Lipitor treatments is being planned to determine whether its effects on diastolic blood pressure are different for men and women.Identify which of these designs is most appropriate for the given experiment: completely randomized design, randomized block design, or matched pairs
An ad for Big Skinny wallets included the statement that one of their wallets “reduces your filled wallet size by 50%–200%.” What is wrong with this statement?Answer the given questions, which are related to percentages.
Lunesta is a drug designed to treat insomnia. In a clinical trial of Lunesta, amounts of sleep each night are measured before and after subjects have been treated with the drug.Identify which of these designs is most appropriate for the given experiment: completely randomized design, randomized
Researchers from the National Institutes of Health want to determine the current rates of marijuana consumption among adults living in states that have legalized the use of marijuana. They conduct a survey of 500 adults in those states.Indicate whether the observational study used is
As part of a project in a statistics class, students report the last four digits of their Social Security numbers, and the average (mean) of those digits is computed to be 4.7.Identify the level of measurement of the data as nominal, ordinal, interval, or ratio. Also, explain what is wrong with the
Samples of subjects with and without heart disease were selected, then researchers looked back in time to determine whether they took aspirin on a regular basis.Indicate whether the observational study used is cross-sectional, retrospective, or prospective.
The first Super Bowl attended by the author was Super Bowl XLVIII. On the first play of the game, the Seattle defense scored on a safety. The defensive players wore jerseys numbered 31, 28, 41, 56, 25, 54, 69, 50, 91, 72, 29, and the average (mean) of those numbers is 49.6.Identify the level of
In a survey conducted by Opinion Research Corporation, 1000 adults were asked to identify “what is inappropriate in the workplace.” Of the 1000 subjects, 70% said that miniskirts were not appropriate in the workplace.a. What is 70% of 1000?b. Among the 1000 respondents, 550 said that shorts are
Phase II of the Nurses’ Health Study was started in 1989 with 116,000 female registered nurses. The study is ongoing.Indicate whether the observational study used is cross-sectional, retrospective, or prospective.
Body temperatures (in degrees Fahrenheit) listed in Data Set 3 ?Body Temperatures? in Appendix B. Determine which of the four levels of measurement (nominal, ordinal, interval, ratio) is most appropriate. Appendix B DAY 1-8 AM DAY 1-12 AM DAY 2-8 AM DAY 2-12 AM SEX SMOKE 98.0 98.0 98.0 98.6 97.4
The electronic cigarette maker V2 Cigs sponsored a poll showing that 55% of smokers surveyed say that they feel ostracized “sometimes,” “often,” or “always.”Identify what is wrong.
The author rated the movie Star Wars: The Force Awakens with 5 stars on a scale of 5 stars.Determine which of the four levels of measurement (nominal, ordinal, interval, ratio) is most appropriate.
In a USA Today online poll, 951 Internet users chose to respond, and 57% of them said that they prefer drinking bottled water instead of tap water.Identify what is wrong.
Baseball statistician Bill James records the years in which the baseball World Series is won by a team from the National League.Determine which of the four levels of measurement (nominal, ordinal, interval, ratio) is most appropriate.
In a poll sponsored by the Idaho Potato Commission, 1000 adults were asked to select their favorite vegetables, and the favorite choice was potatoes, which were selected by 26% of the respondents.Identify what is wrong.
In a study of fast food service times, a researcher records the time intervals of drive-up customers beginning when they place their order and ending when they receive their order.Determine which of the four levels of measurement (nominal, ordinal, interval, ratio) is most appropriate.
A medical researcher tested for a difference in systolic blood pressure levels between male and female students who are 12 years of age. She randomly selected four males and four females for her study.Determine whether the study is an experiment or an observational study, and then identify a major
Colors of M&Ms (red, orange, yellow, brown, blue, green) listed in Data Set 27 “M&M Weights” in Appendix BDetermine which of the four levels of measurement (nominal, ordinal, interval, ratio) is most appropriate.
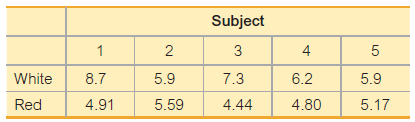
Considering the source of the data, does that source appear to be biased in some way? Refer to the data in the table below. The entries are white blood cell counts (1000 cells ,?L) and red blood cell counts (million cells ,?L) from male subjects examined as part of a large health study conducted
For the presidential election of 2016, ABC News conducts an exit poll in which voters are asked to identify the political party (Democratic, Republican, and so on) that they registered with.Determine which of the four levels of measurement (nominal, ordinal, interval, ratio) is most appropriate.
The Physicians’ Health Study involved 22,071 male physicians. Based on random selections, 11,037 of them were treated with aspirin and the other 11,034 were given placebos. The study was stopped early because it became clear that aspirin reduced the risk of myocardial infarctions by a substantial
U.S. News & World Report periodically provides its rankings of national universities, and in a recent year the ranks for Princeton, Harvard, and ale were 1, 2, and 3, respectively.Determine which of the four levels of measurement (nominal, ordinal, interval, ratio) is most appropriate.
Given that the data are matched and considering the units of the data, does it make sense to use the difference between each white blood cell count and the corresponding red blood cell count? Why or why not? Refer to the data in the table below. The entries are white blood cell counts (1000 cells
The Insurance Institute for Highway Safety collects data consisting of the numbers of motor vehicle fatalities caused by driving while texting.Determine whether the data are from a discrete or continuous data set.
Showing 300 - 400
of 478
1
2
3
4
5
Step by Step Answers