New Semester
Started
Get
50% OFF
Study Help!
--h --m --s
Claim Now
Question Answers
Textbooks
Find textbooks, questions and answers
Oops, something went wrong!
Change your search query and then try again
S
Books
FREE
Study Help
Expert Questions
Accounting
General Management
Mathematics
Finance
Organizational Behaviour
Law
Physics
Operating System
Management Leadership
Sociology
Programming
Marketing
Database
Computer Network
Economics
Textbooks Solutions
Accounting
Managerial Accounting
Management Leadership
Cost Accounting
Statistics
Business Law
Corporate Finance
Finance
Economics
Auditing
Tutors
Online Tutors
Find a Tutor
Hire a Tutor
Become a Tutor
AI Tutor
AI Study Planner
NEW
Sell Books
Search
Search
Sign In
Register
study help
mathematics
elementary statistics excel
Elementary Statistics Using Excel 6th Edition Mario F. Triola - Solutions
There is a 3.9% rate of positive drug test results among workers in the United States (based on data from Quest Diagnostics). Assuming that this statistic is based on a sample of size 2000, construct a 95% confidence interval estimate of the percentage of positive drug test results. Write a brief
a. Which of the following terms is sometimes used instead of “nonparametric test”: normality test; abnormality test; distribution-free test; last testament; test of patience?b. Why is the term that is the answer to part (a) better than “nonparametric test”?
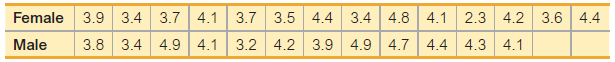
After ranking the combined list of professor evaluations given in Exercise 1, find the sum of the ranks for the female professors. Exercise 1 Female 3.9 3.4 3.8 3.4 4.9 4.1 3.2 4.2 3.9 4.9 4.7 4.4 4.3 4.1 3.7 4.1 3.7 3.5 4.4 3.4 4.8 4.1 2.3 4.2 3.6 4.4 Male
What does it mean when we say that the rank correlation test has an efficiency rating of 0.91 when compared to the parametric test for linear correlation?
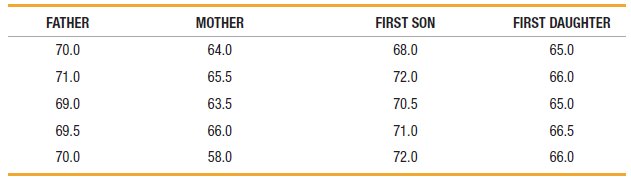
Repeat Exercise 9 ?Heights of Mothers and Daughters? using all of the heights of mothers and daughters listed in Data Set 5 ?Family Heights? in Appendix B. Exercise 9 Data set 5 Height of Mother 68.5 Height of Daughter 63.5 63.5 60.0 64.0 69.0 68.0 61.0 69.0 64.0 66.0 63.5 64.5 65.5 69.0 68.0
A formal hypothesis test is to be conducted using the claim that the mean height of men is equal to 174.1 cm.a. What is the null hypothesis, and how is it denoted?b. What is the alternative hypothesis, and how is it denoted?c. What are the possible conclusions that can be made about the null
Using the methods of this chapter, identify the distribution that should be used for testing a claim about the given population parameter.a. Meanb. Proportionc. Standard deviation
A quality control analyst has collected a random sample of 12 smartphone batteries and she plans to test their voltage level and construct a 95% confidence interval estimate of the mean voltage level for the population of batteries. What requirements must be satisfied in order to construct the
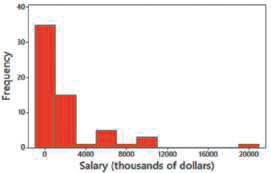
Confidence level is 99%, s = 3342 thousand dollars, and the histogram of 61 player salaries (thousands of dollars) is shown in Exercise 6. Assume that we want to construct a confidence interval. Do one of the following, as appropriate:? (a) Find the critical value t?/2, (b) Find the critical value
Here are summary statistics for randomly selected weights of newborn girls:n = 205, x̅ = 30.4 hg, s = 7.1 hg (based on Data Set 4 “Births” in Appendix B). The confidence level is 95%.Assume that we want to construct a confidence interval. Do one of the following, as appropriate: (a) Find
Find the sample size required to estimate the mean IQ of professional musicians. Assume that we want 98% confidence that the mean from the sample is within three IQ points of the true population mean. Also assume that σ = 15.
Confidence level is 90%, s is not known, and the histogram of 61 player salaries (thousands of dollars) is as shown. Assume that we want to construct a confidence interval. Do one of the following, as appropriate:? (a) Find the critical value t?/2, (b) Find the critical value z?/2, (c) State that
In general, what does “degrees of freedom” refer to? For the sample data described in Exercise 7 “Requirements,” find the number of degrees of freedom, assuming that you want to construct a confidence interval estimate of m using the t distribution.Exercise 7A quality control analyst has
According to the Bureau of Transportation, American Airlines had an on time arrival rate of 80.3% for a given year. Assume that this statistic is based on a sample of 1000 randomly selected American Airlines flights. Find the 99% confidence interval estimate of the percentage of all American
Refer to Exercise 7 “Requirements” and assume that the requirements are satisfied. Find the critical value that would be used for constructing a 95% confidence interval estimate of m using the t distribution.Exercise 7A quality control analyst has collected a random sample of 12 smartphone
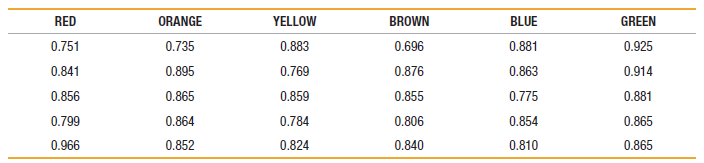
Express the confidence interval using the indicated format. (The confidence intervals are based on the proportions of red, orange, yellow, and blue M&Ms in Data Set 27 ?M&M Weights? in Appendix B.) Express 0.0434 Data set 27 ORANGE 0.735 BLUE RED GREEN BROWN YELLOW 0.881 0.751 0.925
Express the confidence interval using the indicated format. (The confidence intervals are based on the proportions of red, orange, yellow, and blue M&Ms in Data Set 27 ?M&M Weights? in Appendix B.) Express 0.179 Data set 27 ORANGE 0.735 BLUE RED GREEN BROWN YELLOW 0.881 0.751 0.925
Refer to Exercise 7 “Requirements” and assume that sample of 12 voltage levels appears to be from a population with a distribution that is substantially far from being normal. Should a 95% confidence interval estimate of s be constructed using the x2 distribution? If not, what other method
Express the confidence interval using the indicated format. (The confidence intervals are based on the proportions of red, orange, yellow, and blue M&Ms in Data Set 27 ?M&M Weights? in Appendix B.) Express the confidence interval (0.0169, 0.143) in the form of p? - E Data set 27 ORANGE
Confidence level is 95%, ? is not known, and the normal quantile plot of the 17 salaries (thousands of dollars) of Miami Heat basketball players is as shown. Assume that we want to construct a confidence interval. Do one of the following, as appropriate:? (a) Find the critical value t?/2, (b)
Express the confidence interval using the indicated format. (The confidence intervals are based on the proportions of red, orange, yellow, and blue M&Ms in Data Set 27 ?M&M Weights? in Appendix B.) Express the confidence interval 0.270 ? 0.073 in the form of p? - E Data set 27 ORANGE
The examples in this section all involved no more than 20 bootstrap samples. How many should be used in real applications?
USA Today reported that 40% of people surveyed planned to use accumulated loose change for paying bills. The margin of error was given as ± 3.1 percentage points. Identify the confidence interval that corresponds to that information.Exercise 1Here is a 95% confidence interval estimate of the
Given the sample data from Exercise 2, which of the following are not possible bootstrap samples?a. 12, 19, 13, 43, 15b. 12, 19, 15 c. 12, 12, 12, 43, 43d. 14, 20, 12, 19, 15e. 12, 13, 13, 12, 43, 15, 19
What is the level of measurement of these data (nominal, ordinal, interval, ratio)? Are the original unrounded arrival times continuous data or discrete data?Listed below are the arrival delay times (min) of randomly selected American Airlines flights that departed from JFK in New York bound for
For the survey described in Exercise 1 “Celebrities and the Law,” find the critical value that would be used for constructing a 99% confidence interval estimate of the population proportion.Exercise 1Here is a 95% confidence interval estimate of the proportion of adults who say that the law
Write a brief statement that correctly interprets the confidence interval given in Exercise 1 “Celebrities and the Law.”Exercise 1Here is a 95% confidence interval estimate of the proportion of adults who say that the law goes easy on celebrities: 0.692 < p < 0.748 (based on data from a
Here is a 95% confidence interval estimate of the proportion of adults who say that the law goes easy on celebrities: 0.692 < p < 0.748 (based on data from a Rasmussen Reports survey). What is the best point estimate of the proportion of adults in the population who say that the law goes easy
Assume that a randomly selected subject is given a bone density test. Those test scores are normally distributed with a mean of 0 and a standard deviation of 1. In each case, draw a graph, then find the probability of the given bone density test scores. If using Excel instead of Table A-2, round
Between 1.50 and 2.50Assume that a randomly selected subject is given a bone density test. Those test scores are normally distributed with a mean of 0 and a standard deviation of 1. In each case, draw a graph, then find the probability of the given bone density test scores. If using Excel instead
Between and -2.55 and -2.00Assume that a randomly selected subject is given a bone density test. Those test scores are normally distributed with a mean of 0 and a standard deviation of 1. In each case, draw a graph, then find the probability of the given bone density test scores. If using Excel
Between -2.75 and -0.75Assume that a randomly selected subject is given a bone density test. Those test scores are normally distributed with a mean of 0 and a standard deviation of 1. In each case, draw a graph, then find the probability of the given bone density test scores. If using Excel instead
Between -2.00 and 2.00Assume that a randomly selected subject is given a bone density test. Those test scores are normally distributed with a mean of 0 and a standard deviation of 1. In each case, draw a graph, then find the probability of the given bone density test scores. If using Excel instead
Between -3.00 and 3.00Assume that a randomly selected subject is given a bone density test. Those test scores are normally distributed with a mean of 0 and a standard deviation of 1. In each case, draw a graph, then find the probability of the given bone density test scores. If using Excel instead
Between -1.00 and 5.00Assume that a randomly selected subject is given a bone density test. Those test scores are normally distributed with a mean of 0 and a standard deviation of 1. In each case, draw a graph, then find the probability of the given bone density test scores. If using Excel instead
Between -4.27 and 2.34Assume that a randomly selected subject is given a bone density test. Those test scores are normally distributed with a mean of 0 and a standard deviation of 1. In each case, draw a graph, then find the probability of the given bone density test scores. If using Excel instead
Less than 4.55Assume that a randomly selected subject is given a bone density test. Those test scores are normally distributed with a mean of 0 and a standard deviation of 1. In each case, draw a graph, then find the probability of the given bone density test scores. If using Excel instead of Table
Greater than -3.75Assume that a randomly selected subject is given a bone density test. Those test scores are normally distributed with a mean of 0 and a standard deviation of 1. In each case, draw a graph, then find the probability of the given bone density test scores. If using Excel instead of
Less than 0Assume that a randomly selected subject is given a bone density test. Those test scores are normally distributed with a mean of 0 and a standard deviation of 1. In each case, draw a graph, then find the probability of the given bone density test scores. If using Excel instead of Table
Between 2.00 and 3.00Assume that a randomly selected subject is given a bone density test. Those test scores are normally distributed with a mean of 0 and a standard deviation of 1. In each case, draw a graph, then find the probability of the given bone density test scores. If using Excel instead
Greater than 0.18Assume that a randomly selected subject is given a bone density test. Those test scores are normally distributed with a mean of 0 and a standard deviation of 1. In each case, draw a graph, then find the probability of the given bone density test scores. If using Excel instead of
Greater than -2.00Assume that a randomly selected subject is given a bone density test. Those test scores are normally distributed with a mean of 0 and a standard deviation of 1. In each case, draw a graph, then find the probability of the given bone density test scores. If using Excel instead of
Greater than -3.05Assume that a randomly selected subject is given a bone density test. Those test scores are normally distributed with a mean of 0 and a standard deviation of 1. In each case, draw a graph, then find the probability of the given bone density test scores. If using Excel instead of
Greater than 0.25Assume that a randomly selected subject is given a bone density test. Those test scores are normally distributed with a mean of 0 and a standard deviation of 1. In each case, draw a graph, then find the probability of the given bone density test scores. If using Excel instead of
Less than 2.56Assume that a randomly selected subject is given a bone density test. Those test scores are normally distributed with a mean of 0 and a standard deviation of 1. In each case, draw a graph, then find the probability of the given bone density test scores. If using Excel instead of Table
Less than 1.28Assume that a randomly selected subject is given a bone density test. Those test scores are normally distributed with a mean of 0 and a standard deviation of 1. In each case, draw a graph, then find the probability of the given bone density test scores. If using Excel instead of Table
Less than -1.96Assume that a randomly selected subject is given a bone density test. Those test scores are normally distributed with a mean of 0 and a standard deviation of 1. In each case, draw a graph, then find the probability of the given bone density test scores. If using Excel instead of
Less than -1.23Assume that a randomly selected subject is given a bone density test. Those test scores are normally distributed with a mean of 0 and a standard deviation of 1. In each case, draw a graph, then find the probability of the given bone density test scores. If using Excel instead of
The Framingham Heart Study was started in 1948 and is ongoing. Its focus is on heart disease.Indicate whether the observational study used is cross-sectional, retrospective, or prospective.
Find the indicated critical value. Round results to two decimal places.z0.15
Find the indicated critical value. Round results to two decimal places.z0.04
Find the indicated critical value. Round results to two decimal places.z0.02
Find the indicated critical value. Round results to two decimal places.z0.10
Find the bone density scores that can be used as cutoff values separating the lowest 3% and highest 3%.Assume that a randomly selected subject is given a bone density test. Bone density test scores are normally distributed with a mean of 0 and a standard deviation of 1. In each case, draw a graph,
If bone density scores in the bottom 2% and the top 2% are used as cutoff points for levels that are too low or too high, find the two readings that are cutoff values.Assume that a randomly selected subject is given a bone density test. Bone density test scores are normally distributed with a mean
Find P10, the 10th percentile. This is the bone density score separating the bottom 10% from the top 90%.Assume that a randomly selected subject is given a bone density test. Bone density test scores are normally distributed with a mean of 0 and a standard deviation of 1. In each case, draw a
Find P99, the 99th percentile. This is the bone density score separating the bottom 99% from the top 1%.Assume that a randomly selected subject is given a bone density test. Bone density test scores are normally distributed with a mean of 0 and a standard deviation of 1. In each case, draw a graph,
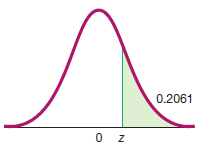
Find the indicated z score. The graph depicts the standard normal distribution of bone density scores with mean 0 and standard deviation 1. 0.2061
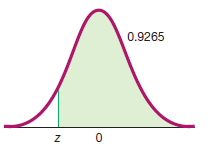
Find the indicated z score. The graph depicts the standard normal distribution of bone density scores with mean 0 and standard deviation 1. 0.9265
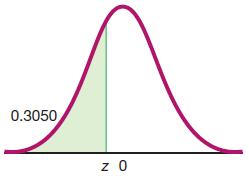
Find the indicated z score. The graph depicts the standard normal distribution of bone density scores with mean 0 and standard deviation 1. 0.3050 z 0
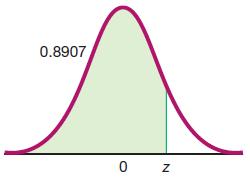
Find the indicated z score. The graph depicts the standard normal distribution of bone density scores with mean 0 and standard deviation 1. 0.8907
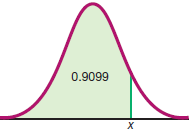
Find the indicated IQ score and round to the nearest whole number. The graphs depict IQ scores of adults, and those scores are normally distributed with a mean of 100 and a standard deviation of 15 (as on the Wechsler IQ test). 0.9099 х
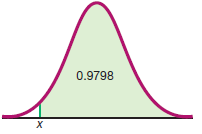
Find the indicated IQ score and round to the nearest whole number. The graphs depict IQ scores of adults, and those scores are normally distributed with a mean of 100 and a standard deviation of 15 (as on the Wechsler IQ test). 0.9798 х
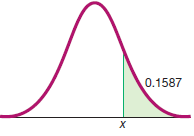
Find the indicated IQ score and round to the nearest whole number. The graphs depict IQ scores of adults, and those scores are normally distributed with a mean of 100 and a standard deviation of 15 (as on the Wechsler IQ test). 0.1587 х
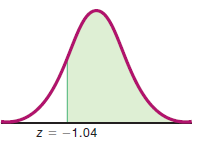
Find the area of the shaded region. The graph depicts the standard normal distribution of bone density scores with mean 0 and standard deviation 1. z = -1.04
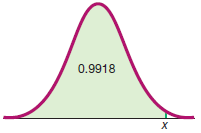
Find the indicated IQ score and round to the nearest whole number. The graphs depict IQ scores of adults, and those scores are normally distributed with a mean of 100 and a standard deviation of 15 (as on the Wechsler IQ test). 0.9918 х
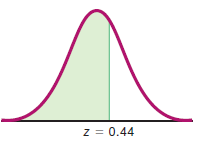
Find the area of the shaded region. The graph depicts the standard normal distribution of bone density scores with mean 0 and standard deviation 1. z = 0.44
If 16 women are randomly selected, find the probability that the mean of their diastolic blood pressure levels is less than 75 mm Hg. Assume that women have diastolic blood pressure measures that are normally distributed with a mean of 70.2 mm Hg and a standard deviation of 11.2 mm Hg (based on
Find P90, the 90th percentile for the diastolic blood pressure levels of women. Assume that women have diastolic blood pressure measures that are normally distributed with a mean of 70.2 mm Hg and a standard deviation of 11.2 mm Hg (based on Data Set 1 ?Body Data? in Appendix B). Data set 1 HDL
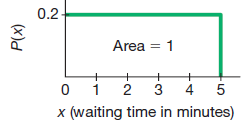
Refer to the continuous uniform distribution depicted in Figure 6-2 and described in Example 1. Assume that a passenger is randomly selected, and find the probability that the waiting time is within the given range. Between 2.5 minutes and 4.5 minutes Figure 6-2 0.2 Area = 1 2 3 4 x (waiting time
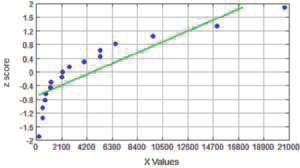
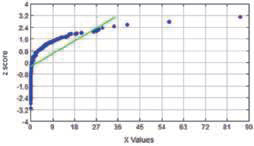
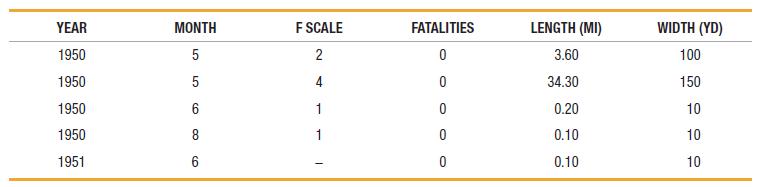
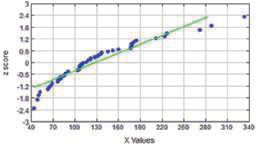
The normal quantile plot represents the distances (miles) that tornadoes traveled (from Data Set 22 ?Tornadoes? in Appendix B). Data set 22 12 24 18 0.0 1.6 24 32 27 36 X Values YEAR MONTH LENGTH (MI) WIDTH (YD) F SCALE FATALITIES 100 1950 1950 1950 5 3.60 5 34.30 150 0.20 10 1950 8 10 0.10
Find the probability that a randomly selected woman has a diastolic blood pressure level between 60 mm Hg and 80 mm Hg. Assume that women have diastolic blood pressure measures that are normally distributed with a mean of 70.2 mm Hg and a standard deviation of 11.2 mm Hg (based on Data Set 1 ?Body
Refer to the continuous uniform distribution depicted in Figure 6-2 and described in Example 1. Assume that a passenger is randomly selected, and find the probability that the waiting time is within the given range. Between 2 minutes and 3 minutes Figure 6-2 0.2 Area = 1 2 3 4 x (waiting time in
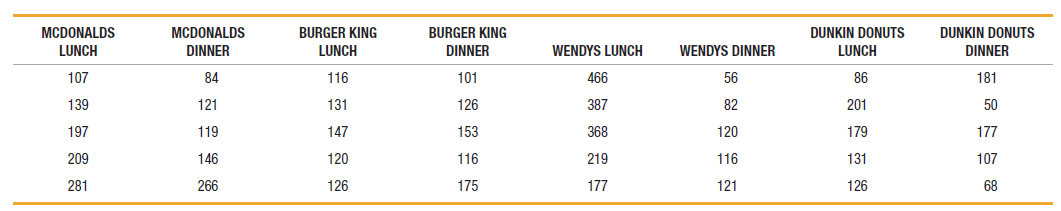
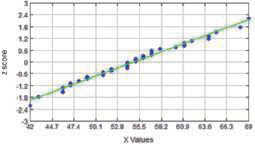
The normal quantile plot represents service times during the dinnerhours at Dunkin? Donuts (from Data Set 25 ?Fast Food? in Appendix ?B). Data set 25 24 18 12 -12 70 100 130 10 130 220 20 200 310 340 X Values 2score MCDONALDS LUNCH MCDONALDS DINNER BURGER KING LUNCH BURGER KING DINNER DUNKIN
Find the probability that a randomly selected woman has a normal diastolic blood pressure level, which is below 80 mm Hg. Assume that women have diastolic blood pressure measures that are normally distributed with a mean of 70.2 mm Hg and a standard deviation of 11.2 mm Hg (based on Data Set 1
Refer to the continuous uniform distribution depicted in Figure 6-2 and described in Example 1. Assume that a passenger is randomly selected, and find the probability that the waiting time is within the given range. Less than 4.00 minutes Figure 6-2 0.2 Area = 1 2 3 4 x (waiting time in minutes)
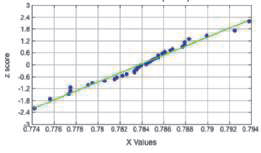
The normal quantile plot represents weights (pounds) of the contents of cans of Diet Pepsi from Data Set 26 ?Cola Weights and Volumes? in Appendix B. Data set 26 24 12 12 14 a74 0.776 a77 078 0.782 0764 078 0788 0.79 0.72 0.794 X Values COKE REG WT COKE REG VOL COKE DIET WT COKE DIET VOL PEPSI
Refer to the continuous uniform distribution depicted in Figure 6-2 and described in Example 1. Assume that a passenger is randomly selected, and find the probability that the waiting time is within the given range. Greater than 3.00 minutes Figure 6-2 0.2 Area = 1 2 3 4 x (waiting time in
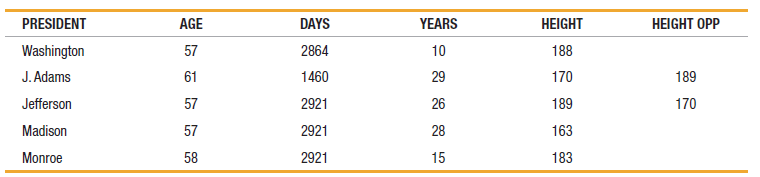
The normal quantile plot represents the ages of presidents of the United States at the times of their inaugurations. The data are from Data Set 15 ?Presidents? in Appendix B. Data set 15 24 18 12 12 44T 47A 501 52 5 82 60.9 36 663 XValues PRESIDENT AGE DAYS YEARS HEIGHT HEIGHT OPP 57 2864 10
For a randomly selected subject, find the probability of a score between 0.87 and 1.78.Assume that scores on a bone mineral density test are normally distributed with a mean of 0 and a standard deviation of 1.
Each week, Nielsen Media Research conducts a survey of 5000 households and records the proportion of households tuned to 60 Minutes. If we obtain a large collection of those proportions and construct a histogram of them, what is the approximate shape of the histogram?
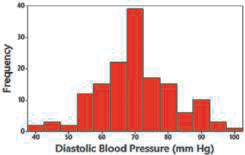
The accompanying histogram is constructed from the diastolic blood pressure measurements of the 147 women included in Data Set 1 “Body Data” in Appendix B. If you plan to conduct further statistical tests and there is a loose requirement of a normally distributed population, what do you
For a randomly selected subject, find the probability of a score greater than -2.93.Assume that scores on a bone mineral density test are normally distributed with a mean of 0 and a standard deviation of 1.
Identify the two requirements necessary for a normal distribution to be a standard normal distribution.
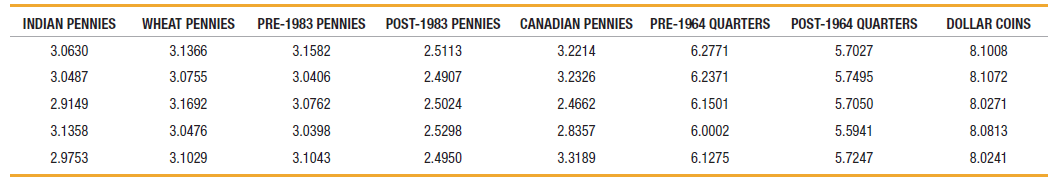
Data set 29 ?Coin Weights? in Appendix B includes weights of 20 one-dollar coins. Given that the sample size is less than 30, what requirement must be met in order to treat the sample mean as a value from a normally distributed population? Identify three tools for verifying that requirement. Data
Find the score separating the lowest 9% of scores from the highest 91%.Assume that scores on a bone mineral density test are normally distributed with a mean of 0 and a standard deviation of 1.
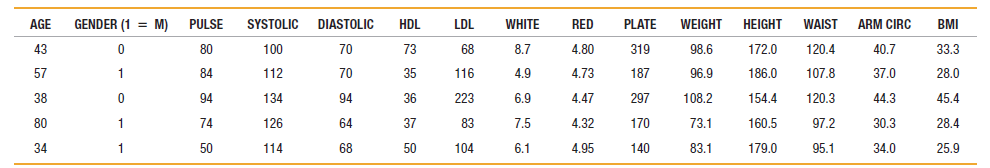
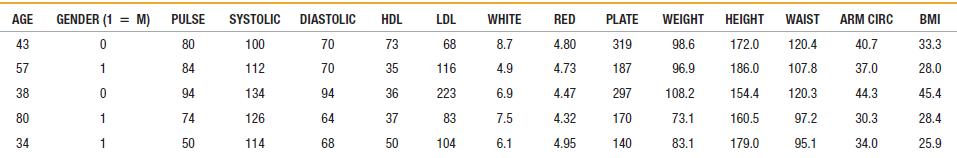
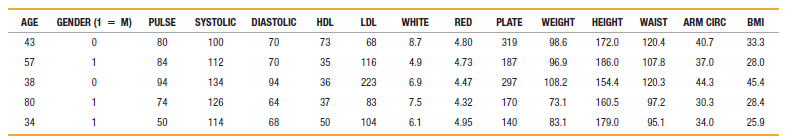
After constructing a histogram of the ages of the 147 women included in Data Set 1 “Body Data” in Appendix B, you see that the histogram is far from being bell-shaped. What do you now know about the pattern of points in the normal quantile plot?Data set 1 AGE GENDER (1 = M) PULSE SYSTOLIC
Weights of golden retriever dogs are normally distributed. Samples of weights of golden retriever dogs, each of size n = 15, are randomly collected and the sample means are found. Is it correct to conclude that the sample means cannot be treated as being from a normal distribution because the
Sketch a graph showing the shape of the distribution of bone density test scores.Assume that scores on a bone mineral density test are normally distributed with a mean of 0 and a standard deviation of 1.
Data Set 1 ?Body Data? in Appendix B includes the heights of 147 randomly selected women, and heights of women are normally distributed. If you were to construct a histogram of the 147 heights of women in Data Set 1, what shape do you expect the histogram to have? If you were to construct a normal
A researcher collects a simple random sample of grade-point averages of statistics students, and she calculates the mean of this sample. Under what conditions can that sample mean be treated as a value from a population having a normal distribution?
Based on data from Bloodjournal.org, 10% of women 65 years of age and older have anemia, which is a deficiency of red blood cells. In tests for anemia, blood samples from 8 women 65 and older are combined. What is the probability that the combined sample tests positive for anemia? Is it likely for
If 12 adult smartphone users are randomly selected, find the probability that fewer than 3 of them use their smartphones in meetings or classes.
In a recent year, the author wrote 181 checks. Find the probability that on a randomly selected day, he wrote at least one check.Use the Poisson distribution to find the indicated probabilities.
In a survey, cell phone users were asked which ear they use to hear their cell phone, and the table is based on their responses (based on data from “Hemispheric Dominance and Cell Phone Use,” by Seidman et al., JAMA Otolaryngology—Head & Neck Surgery, Vol. 139, No. 5).
What is the probability that fewer than three of the five flights arrive on time?
What does the probability of 0+ indicate? Does it indicate that among five randomly selected flights, it is impossible for none of them to arrive on time?
Based on the table, the standard deviation is 0.9 flight. What is the variance? Include appropriate units.
In a U.S. Cellular survey of 500 smartphone users, subjects are asked if they find abbreviations (such as LOL or BFF) annoying, and each response was recorded as “yes,” “no,” or “not sure.”
Find the mean of the number of flights among five that arrive on time.
Showing 100 - 200
of 478
1
2
3
4
5
Step by Step Answers