

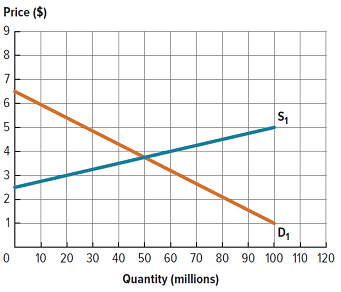
The market shown in Figure 6P-12 is in equilibrium. Suppose there is a $1.50 per unit subsidy
Question:
a. Draw the after-subsidy demand curve.
b. Plot the after-subsidy price paid by consumers and the after-subsidy price paid by sellers.
c. Draw government expenditures for the subsidy.
d. Calculate government expenditures.
Figure 6P-12:
Fantastic news! We've Found the answer you've been seeking!
Step by Step Answer:
a Each unit of the good is now 150 less expensive to buy Thus the ...View the full answer

Answered By
Anthony Ngatia
I have three academic degrees i.e bachelors degree in Education(English & Literature),bachelors degree in business administration(entrepreneurship option),and masters degree in business administration(strategic management) in addition to a diploma in business management.I have spent much of my life in the academia where I have taught at high school,middle level colleges level and at university level.I have been an active academic essays writer since 2011 where I have worked with some of the most reputable essay companies based in Europe and in the US.I have over the years perfected my academic writing skills as a result of tackling numerous different assignments.I do not plagiarize and I maintain competitive quality in all the assignments that I handle.I am driven by strong work ethics and a firm conviction that I should "Do Unto others as I would Like them to do to me".
76+ Reviews
152+ Question Solved
Related Book For 
Question Posted:
