

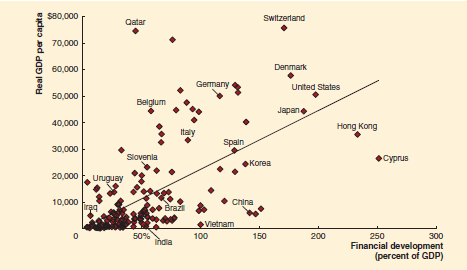
Countries that are above the line in Figure 9.1 have relatively high levels of real GDP per
Question:
Figure 9.1
Fantastic news! We've Found the answer you've been seeking!
Step by Step Answer:
We would expect future growth rates to be higher for co...View the full answer

Answered By
OTIENO OBADO
I have a vast experience in teaching, mentoring and tutoring. I handle student concerns diligently and my academic background is undeniably aesthetic
3+ Reviews
10+ Question Solved
Related Book For 

Money, Banking, and the Financial System
ISBN: 978-0134524061
3rd edition
Authors: R. Glenn Hubbard, Anthony Patrick O'Brien
Question Posted:
