

Question: 6. The PERT network for a project is shown in Figure 11.31. The figure against each activity indicates the expected time in weeks. Find the
6. The PERT network for a project is shown in Figure 11.31. The figure against each activity indicates the expected time in weeks.
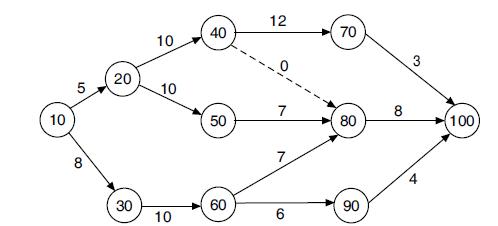
Find the float for each of the activities.
10 20 5 20 10 10 8 30 50 40 10 50 50 12 70 7 8 80 100 7 60 6 90 90
Step by Step Solution
There are 3 Steps involved in it
1 Expert Approved Answer
Step: 1 Unlock

Question Has Been Solved by an Expert!
Get step-by-step solutions from verified subject matter experts
Step: 2 Unlock
Step: 3 Unlock