

Question: Shown below is an AOA network for a small project. The three time estimates, in weeks, for each activity are shown on each arrow. (a)
Shown below is an AOA network for a small project. The three time estimates, in weeks, for each activity are shown on each arrow.
(a) Compute the expected time for each activity.
(b) Find the expected duration of the project.
(c) Find the slack at the nodes that are not on the critical path.
(d) Compute the standard deviation of the critical path.
(e) Using the standard deviation of the critical path as the standard deviation of the project’s duration, compute the probability of completing the project in 35 weeks or less.
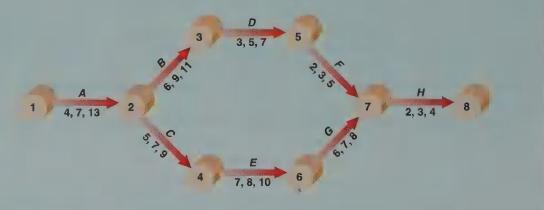
A 4,7,13 2 B 6, 9, 11 5,7,9 D 3, 5, 7 5 E 7, 8, 10 2,3,5 6,7,8 H 2,3,4 8
Step by Step Solution
There are 3 Steps involved in it

Get step-by-step solutions from verified subject matter experts